303 lines
8.6 KiB
Markdown
303 lines
8.6 KiB
Markdown
<h2><center>Logstash</center></h2>
|
||
|
||
------
|
||
|
||

|
||
|
||
## 一:基本概念
|
||
|
||
### 1. Logstash 简介
|
||
|
||
Logstash 是 Elastic Stack 的中央数据流引擎,用于收集、丰富和统一所有数据,而不管格式或模式。
|
||
|
||
相当与Elasticsearch,Kibana,及 Beats 共同使用的时候便会拥有特别强大的实时处理能力。
|
||
|
||
### 2. Logstash 原理
|
||
|
||
Logstash 管道中的每个输入阶段都在其自己的线程中运行。输入将事件写入位于内存(默认)或磁盘上的中央队列。每个管道工作线程从此队列中取出一批事件,通过配置的过滤器运行这批事件,然后通过任何输出运行过滤后的事件。批次的大小和管道工作线程的数量是可配置的。
|
||
|
||
默认情况下,Logstash 使用管道阶段(输入 → 过滤器和过滤器 → 输出)之间的内存有界队列来缓冲事件。如果 Logstash 不安全地终止,则存储在内存中的所有事件都将丢失。为了防止数据丢失,您可以启用 Logstash 将传输中的事件保存到磁盘。
|
||
|
||
## 二:安装部署
|
||
|
||
### 1. 下载安装包
|
||
|
||
官网:[Past Releases of Elastic Stack Software | Elastic](https://www.elastic.co/downloads/past-releases#logstash)
|
||
|
||
```bash
|
||
[root@logstash ~]# wget https://artifacts.elastic.co/downloads/logstash/logstash-8.13.4-linux-x86_64.tar.gz
|
||
```
|
||
|
||
### 2. 解压安装
|
||
|
||
```bash
|
||
[root@logstash ~]# tar xf logstash-8.13.4-linux-x86_64.tar.gz -C /usr/local/
|
||
[root@logstash ~]# mv /usr/local/logstash-8.13.4/ /usr/local/logstash
|
||
```
|
||
|
||
### 3. 配置环境
|
||
|
||
```bash
|
||
[root@logstash ~]# vim /etc/profile
|
||
JAVA_HOME=/usr/local/logstash/jdk
|
||
PATH=$PATH:$JAVA_HOME/bin
|
||
export JAVA_HOME PATH
|
||
[root@logstash ~]# source /etc/profile
|
||
[root@logstash ~]# java -version
|
||
openjdk version "17.0.11" 2024-04-16
|
||
OpenJDK Runtime Environment Temurin-17.0.11+9 (build 17.0.11+9)
|
||
OpenJDK 64-Bit Server VM Temurin-17.0.11+9 (build 17.0.11+9, mixed mode, sharing)
|
||
```
|
||
|
||
### 4. 数据流向
|
||
|
||

|
||
|
||
### 5. 模拟运行
|
||
|
||
**输入和输出都来自于终端**
|
||
|
||
```bash
|
||
[root@logstash ~]# /usr/local/logstash/bin/logstash -e 'input { stdin { } } output { stdout {} }'
|
||
nihao (INPUT)
|
||
{
|
||
"@version" => "1",
|
||
"message" => "nihao (INPUT)",
|
||
"@timestamp" => 2025-05-04T08:54:48.278302130Z,
|
||
"event" => {
|
||
"original" => "nihao (INPUT)"
|
||
},
|
||
"host" => {
|
||
"hostname" => "logstash"
|
||
}
|
||
}
|
||
```
|
||
|
||
**输入来自终端,输出到ES集群**
|
||
|
||
Elasticsearch 从8.0开始, 默认开启了SSL安全验证
|
||
|
||
因此我们需要为 Logstash 配置身份验证凭据才能建立与 Elasticsearch 集群的通信
|
||
|
||
Logstash创建目录存储Elasticsearch的CA证书
|
||
|
||
```bash
|
||
[root@logstash ~]# mkdir /usr/local/logstash/config/certs
|
||
```
|
||
|
||
Elasticsearch中将证书拷贝到Logstash
|
||
|
||
```bash
|
||
[root@logstash ~]# scp 192.168.159.131:/usr/local/elasticsearch/config/certs/elasticsearch-ca.pem /usr/local/logstash/config/certs/
|
||
```
|
||
|
||
创建Logstash采集数据配置文件
|
||
|
||
```bash
|
||
[root@logstash ~]# vim /opt/stdin.conf
|
||
input {
|
||
stdin{}
|
||
}
|
||
output {
|
||
elasticsearch {
|
||
index => "stdin_logstash"
|
||
hosts => [ "https://192.168.159.131:9200" ]
|
||
cacert => "/usr/local/logstash/config/certs/elasticsearch-ca.pem"
|
||
user => "elastic"
|
||
password => "123456"
|
||
}
|
||
}
|
||
```
|
||
|
||
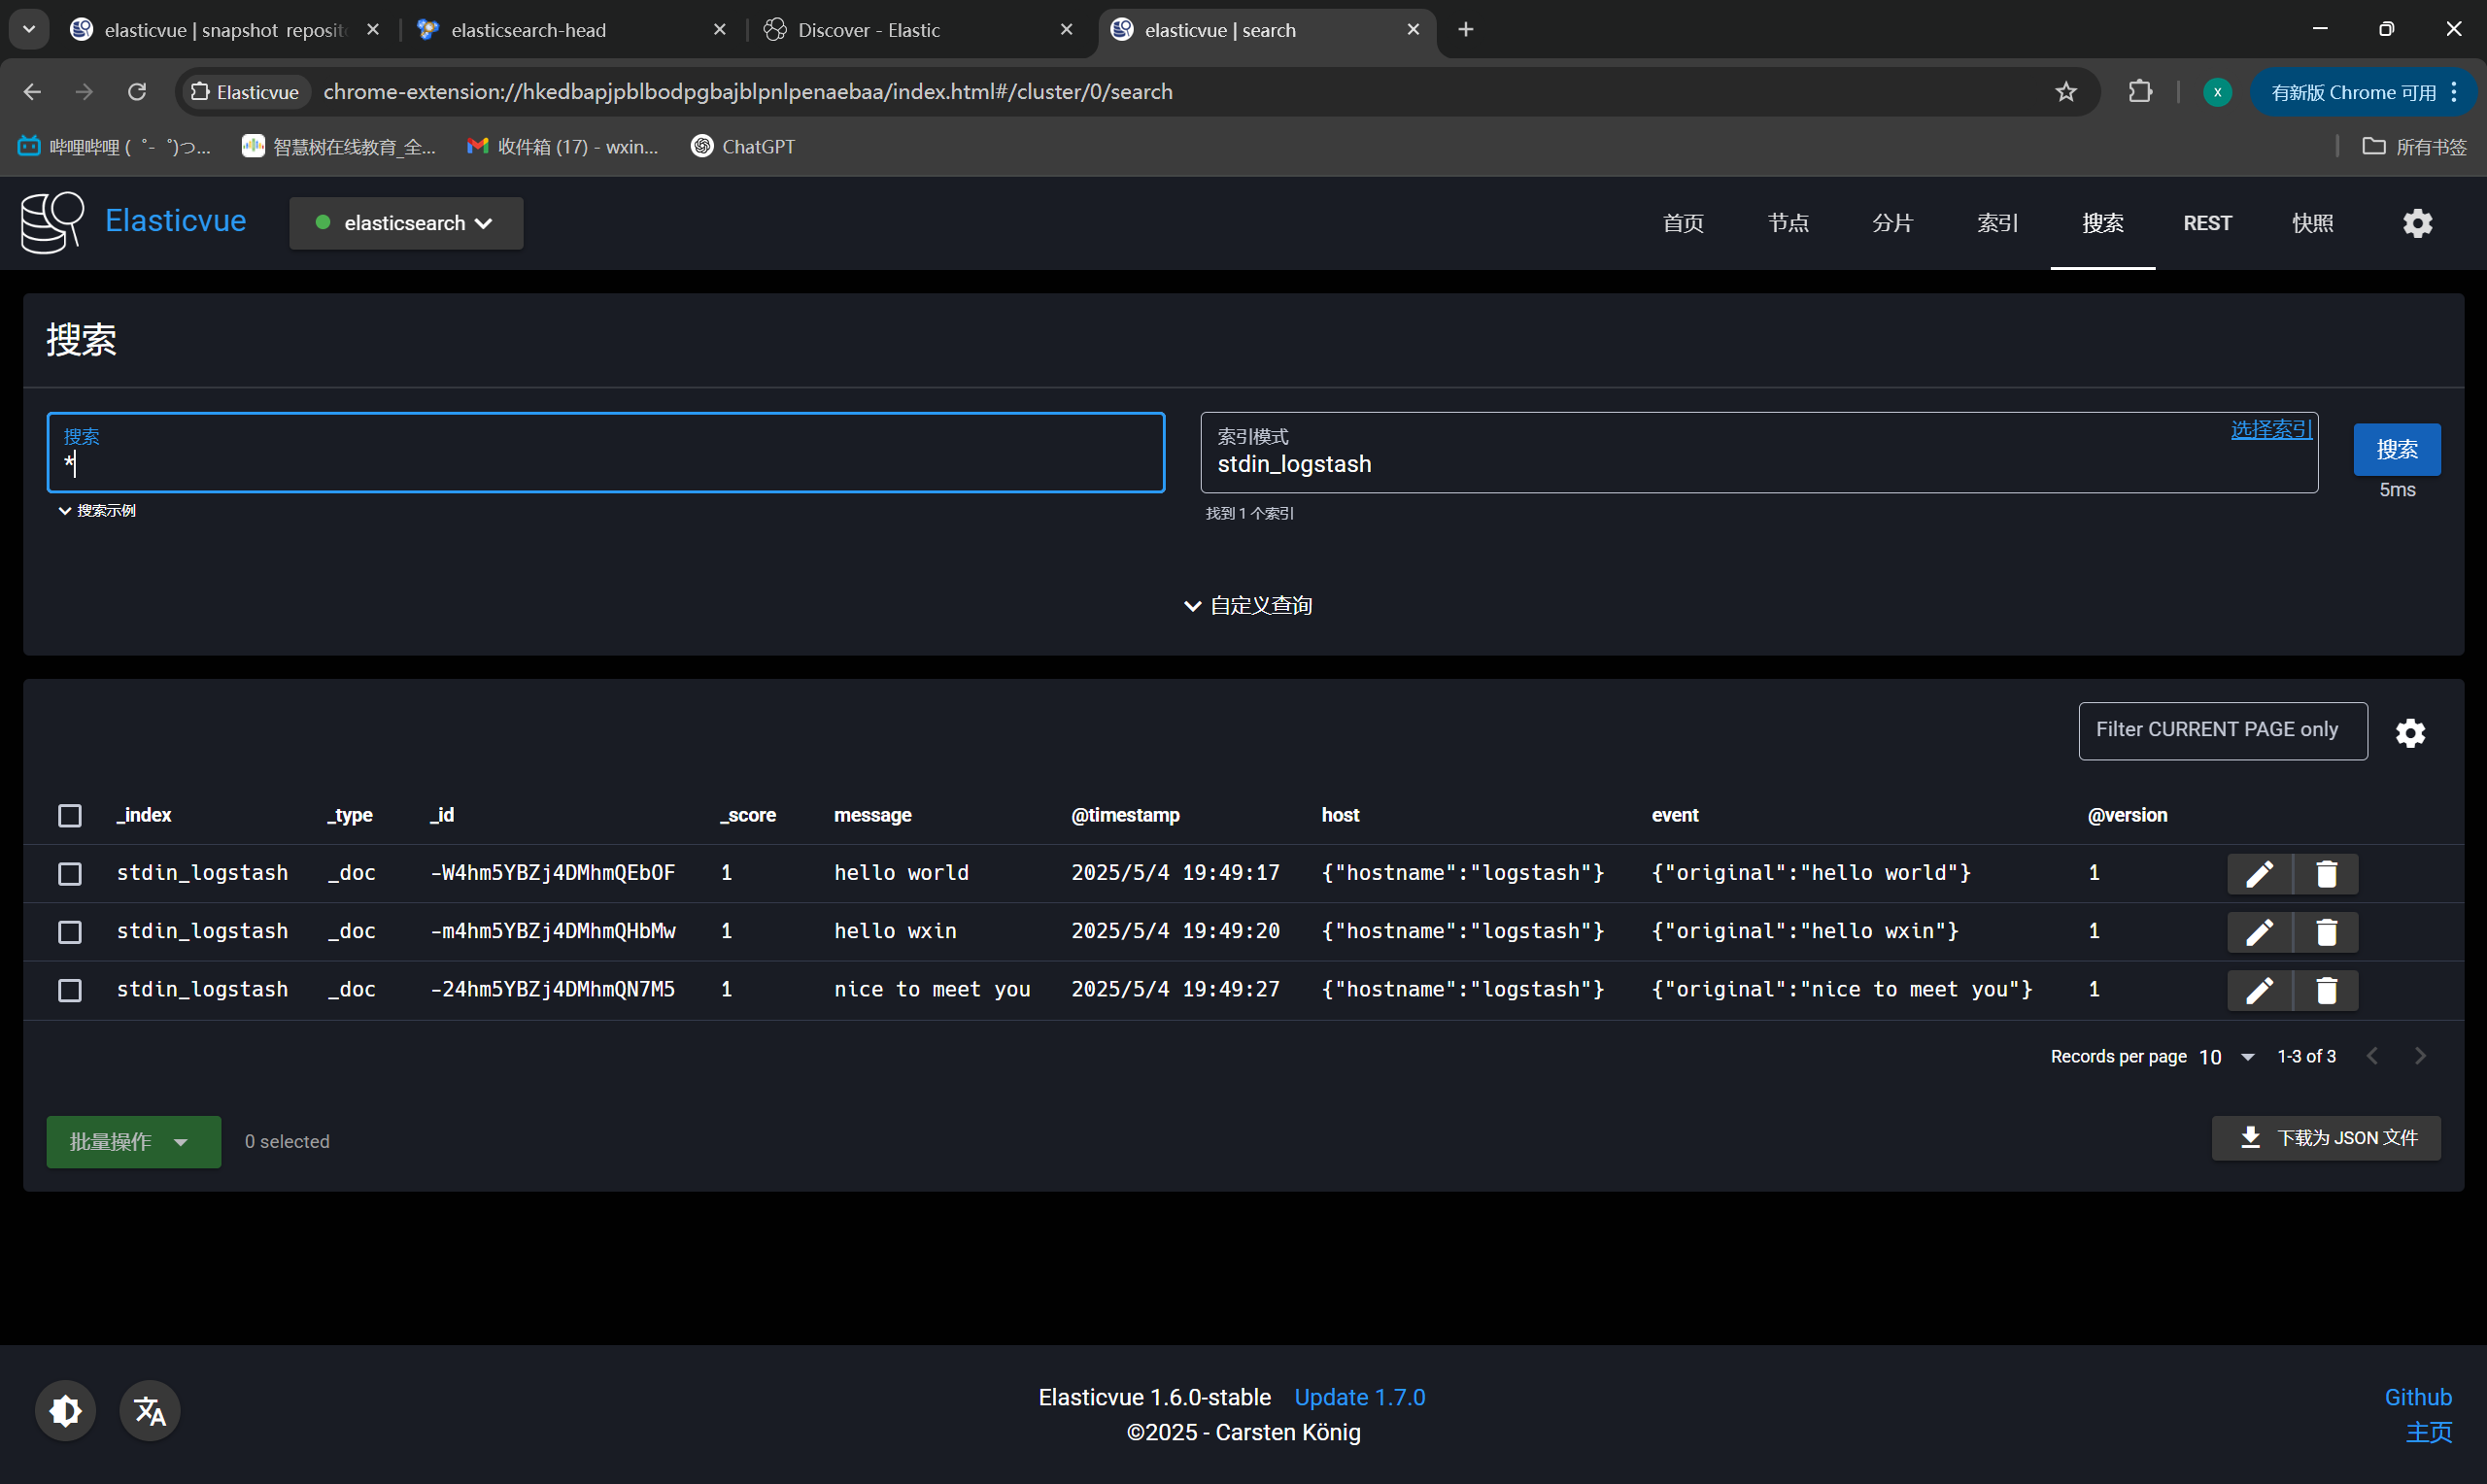
执行Logstash
|
||
|
||
```bash
|
||
[root@logstash ~]# /usr/local/logstash/bin/logstash -f /opt/stdin.conf
|
||
hello world
|
||
hello wxin
|
||
nice to meet you
|
||
```
|
||
|
||
ES插件查看索引信息
|
||
|
||
|
||
|
||
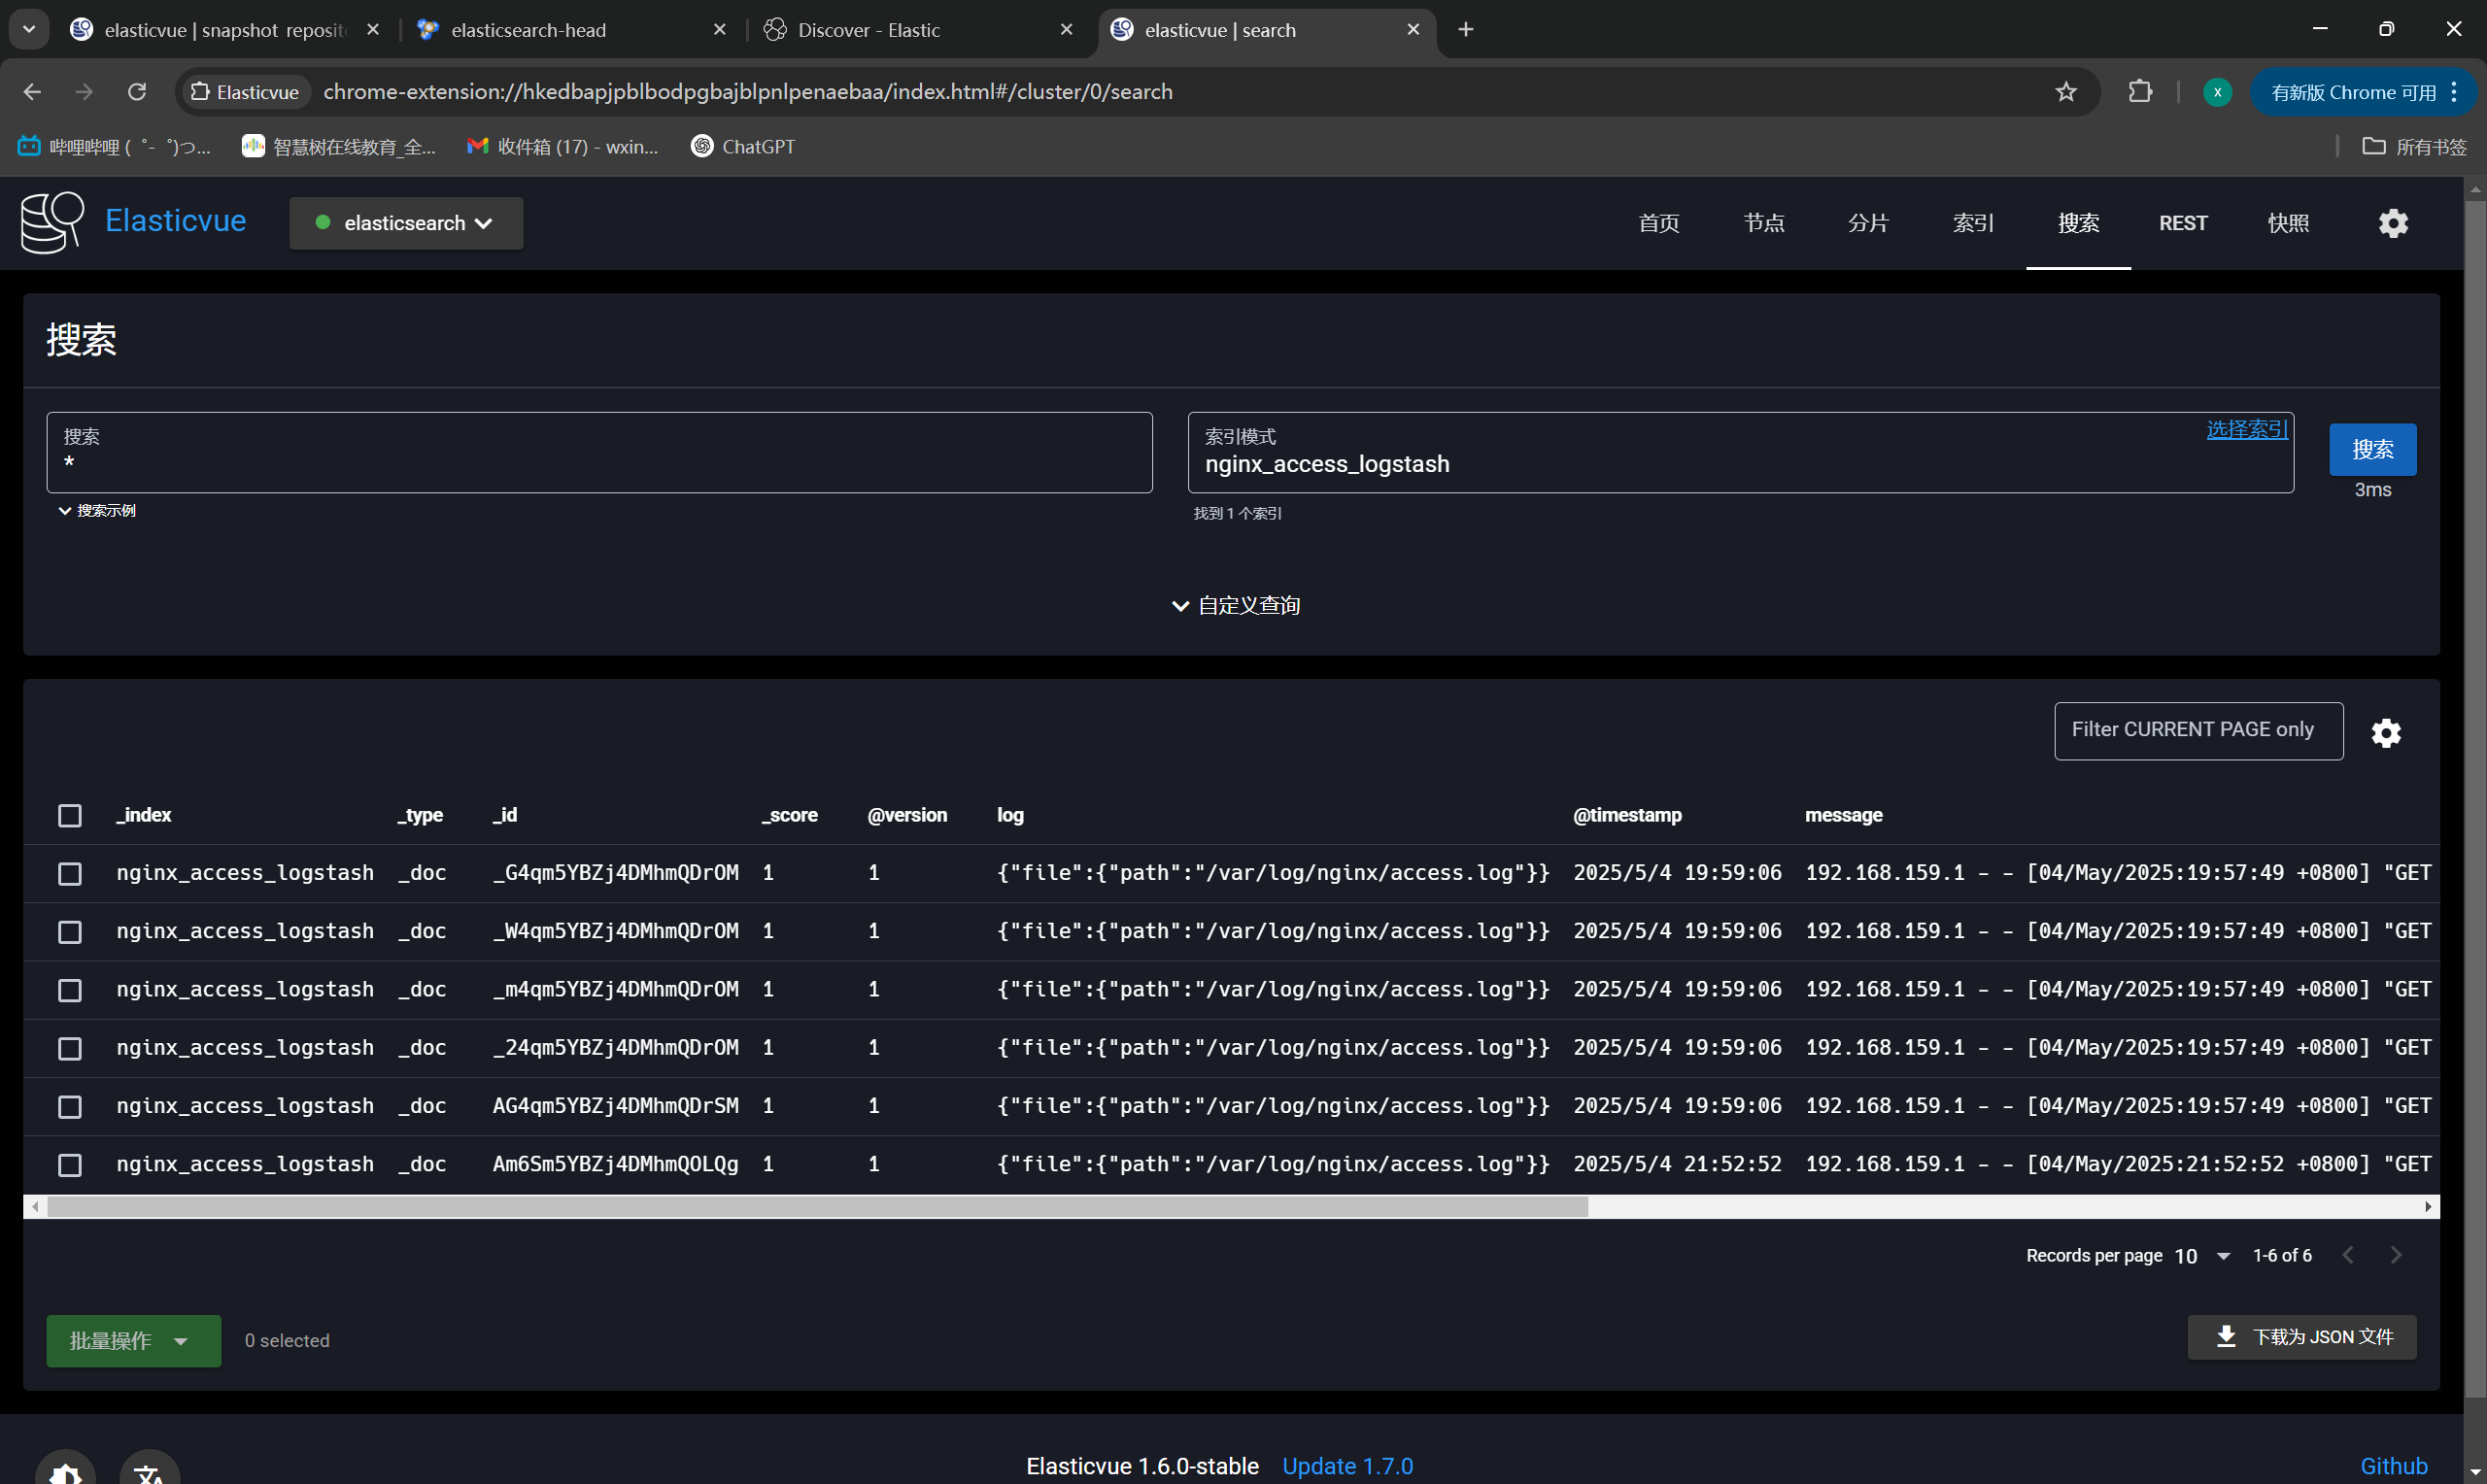
**输入来自日志文件,输出到ES集群**
|
||
|
||
此处只展示Logstash配置文件
|
||
|
||
```bash
|
||
[root@logstash ~]# vim /opt/nginx_access_logstash.conf
|
||
input {
|
||
file {
|
||
path => "/var/log/nginx/access.log"
|
||
start_position => "beginning"
|
||
}
|
||
}
|
||
output {
|
||
elasticsearch {
|
||
index => "nginx_access_logstash"
|
||
hosts => [ "https://192.168.159.131:9200" ]
|
||
cacert => "/usr/local/logstash/config/certs/elasticsearch-ca.pem"
|
||
user => "elastic"
|
||
password => "123456"
|
||
}
|
||
}
|
||
```
|
||
|
||
ES插件展示索引
|
||
|
||
|
||
|
||
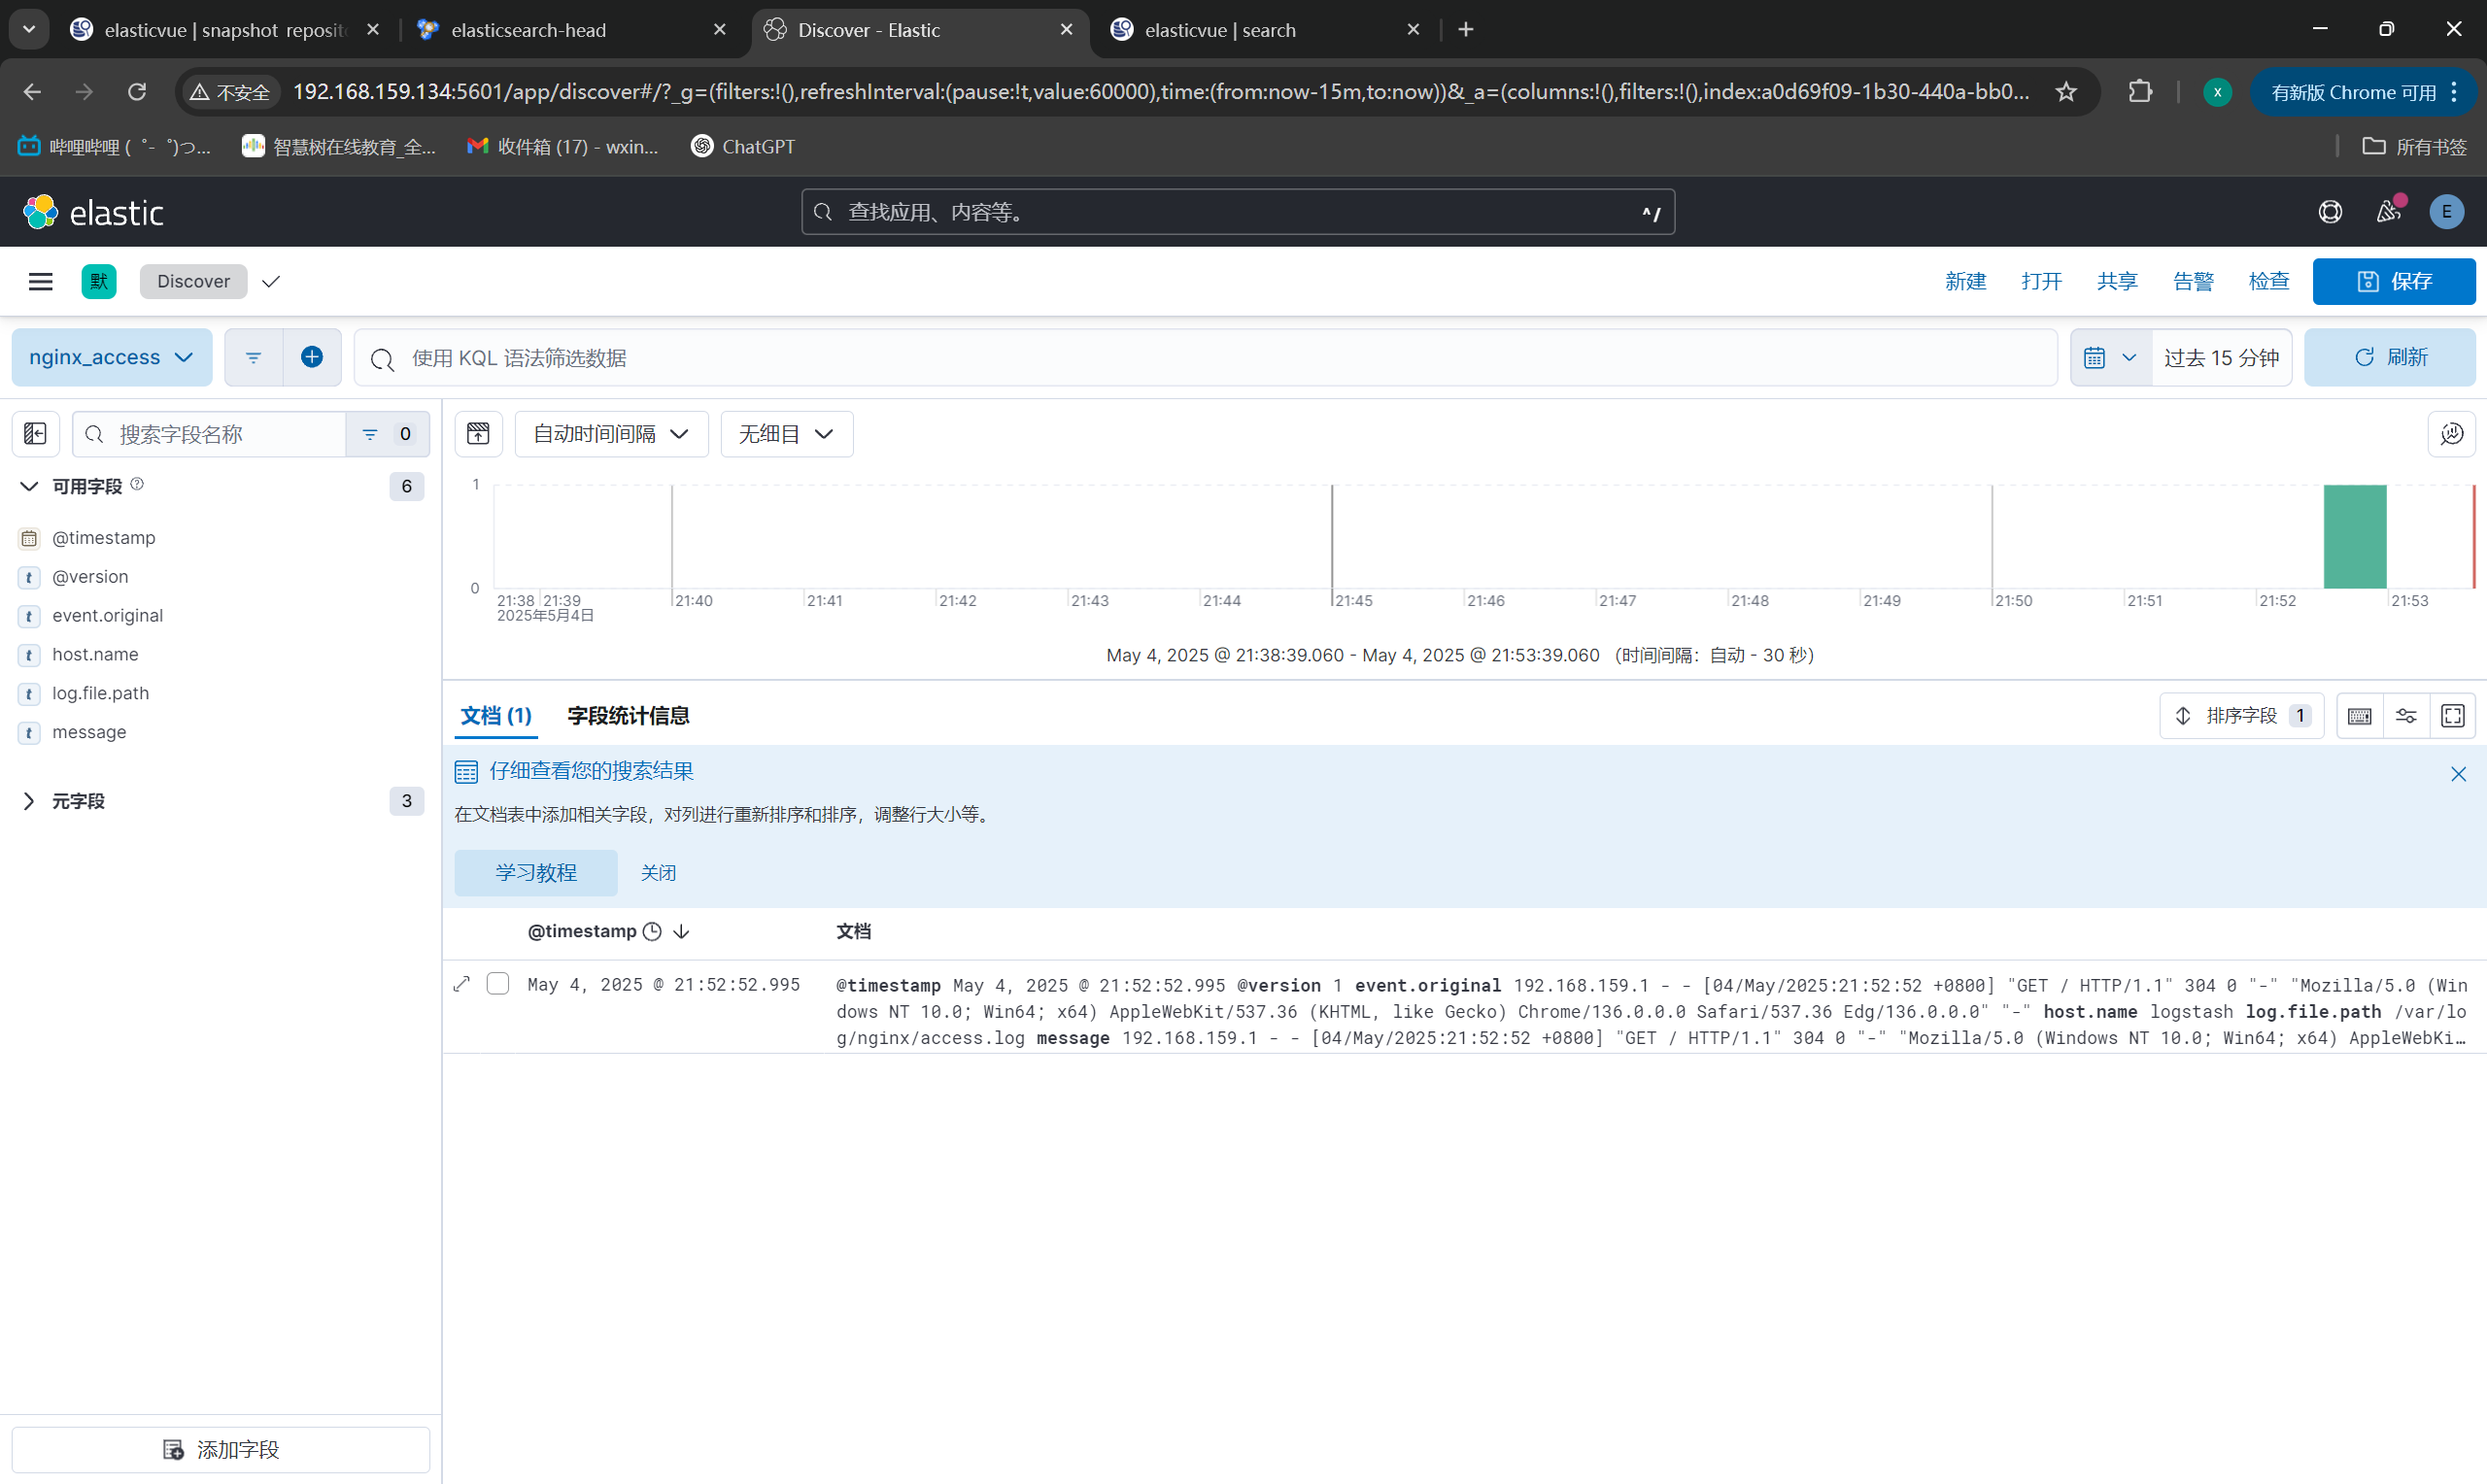
Kibana展示数据
|
||
|
||
|
||
|
||
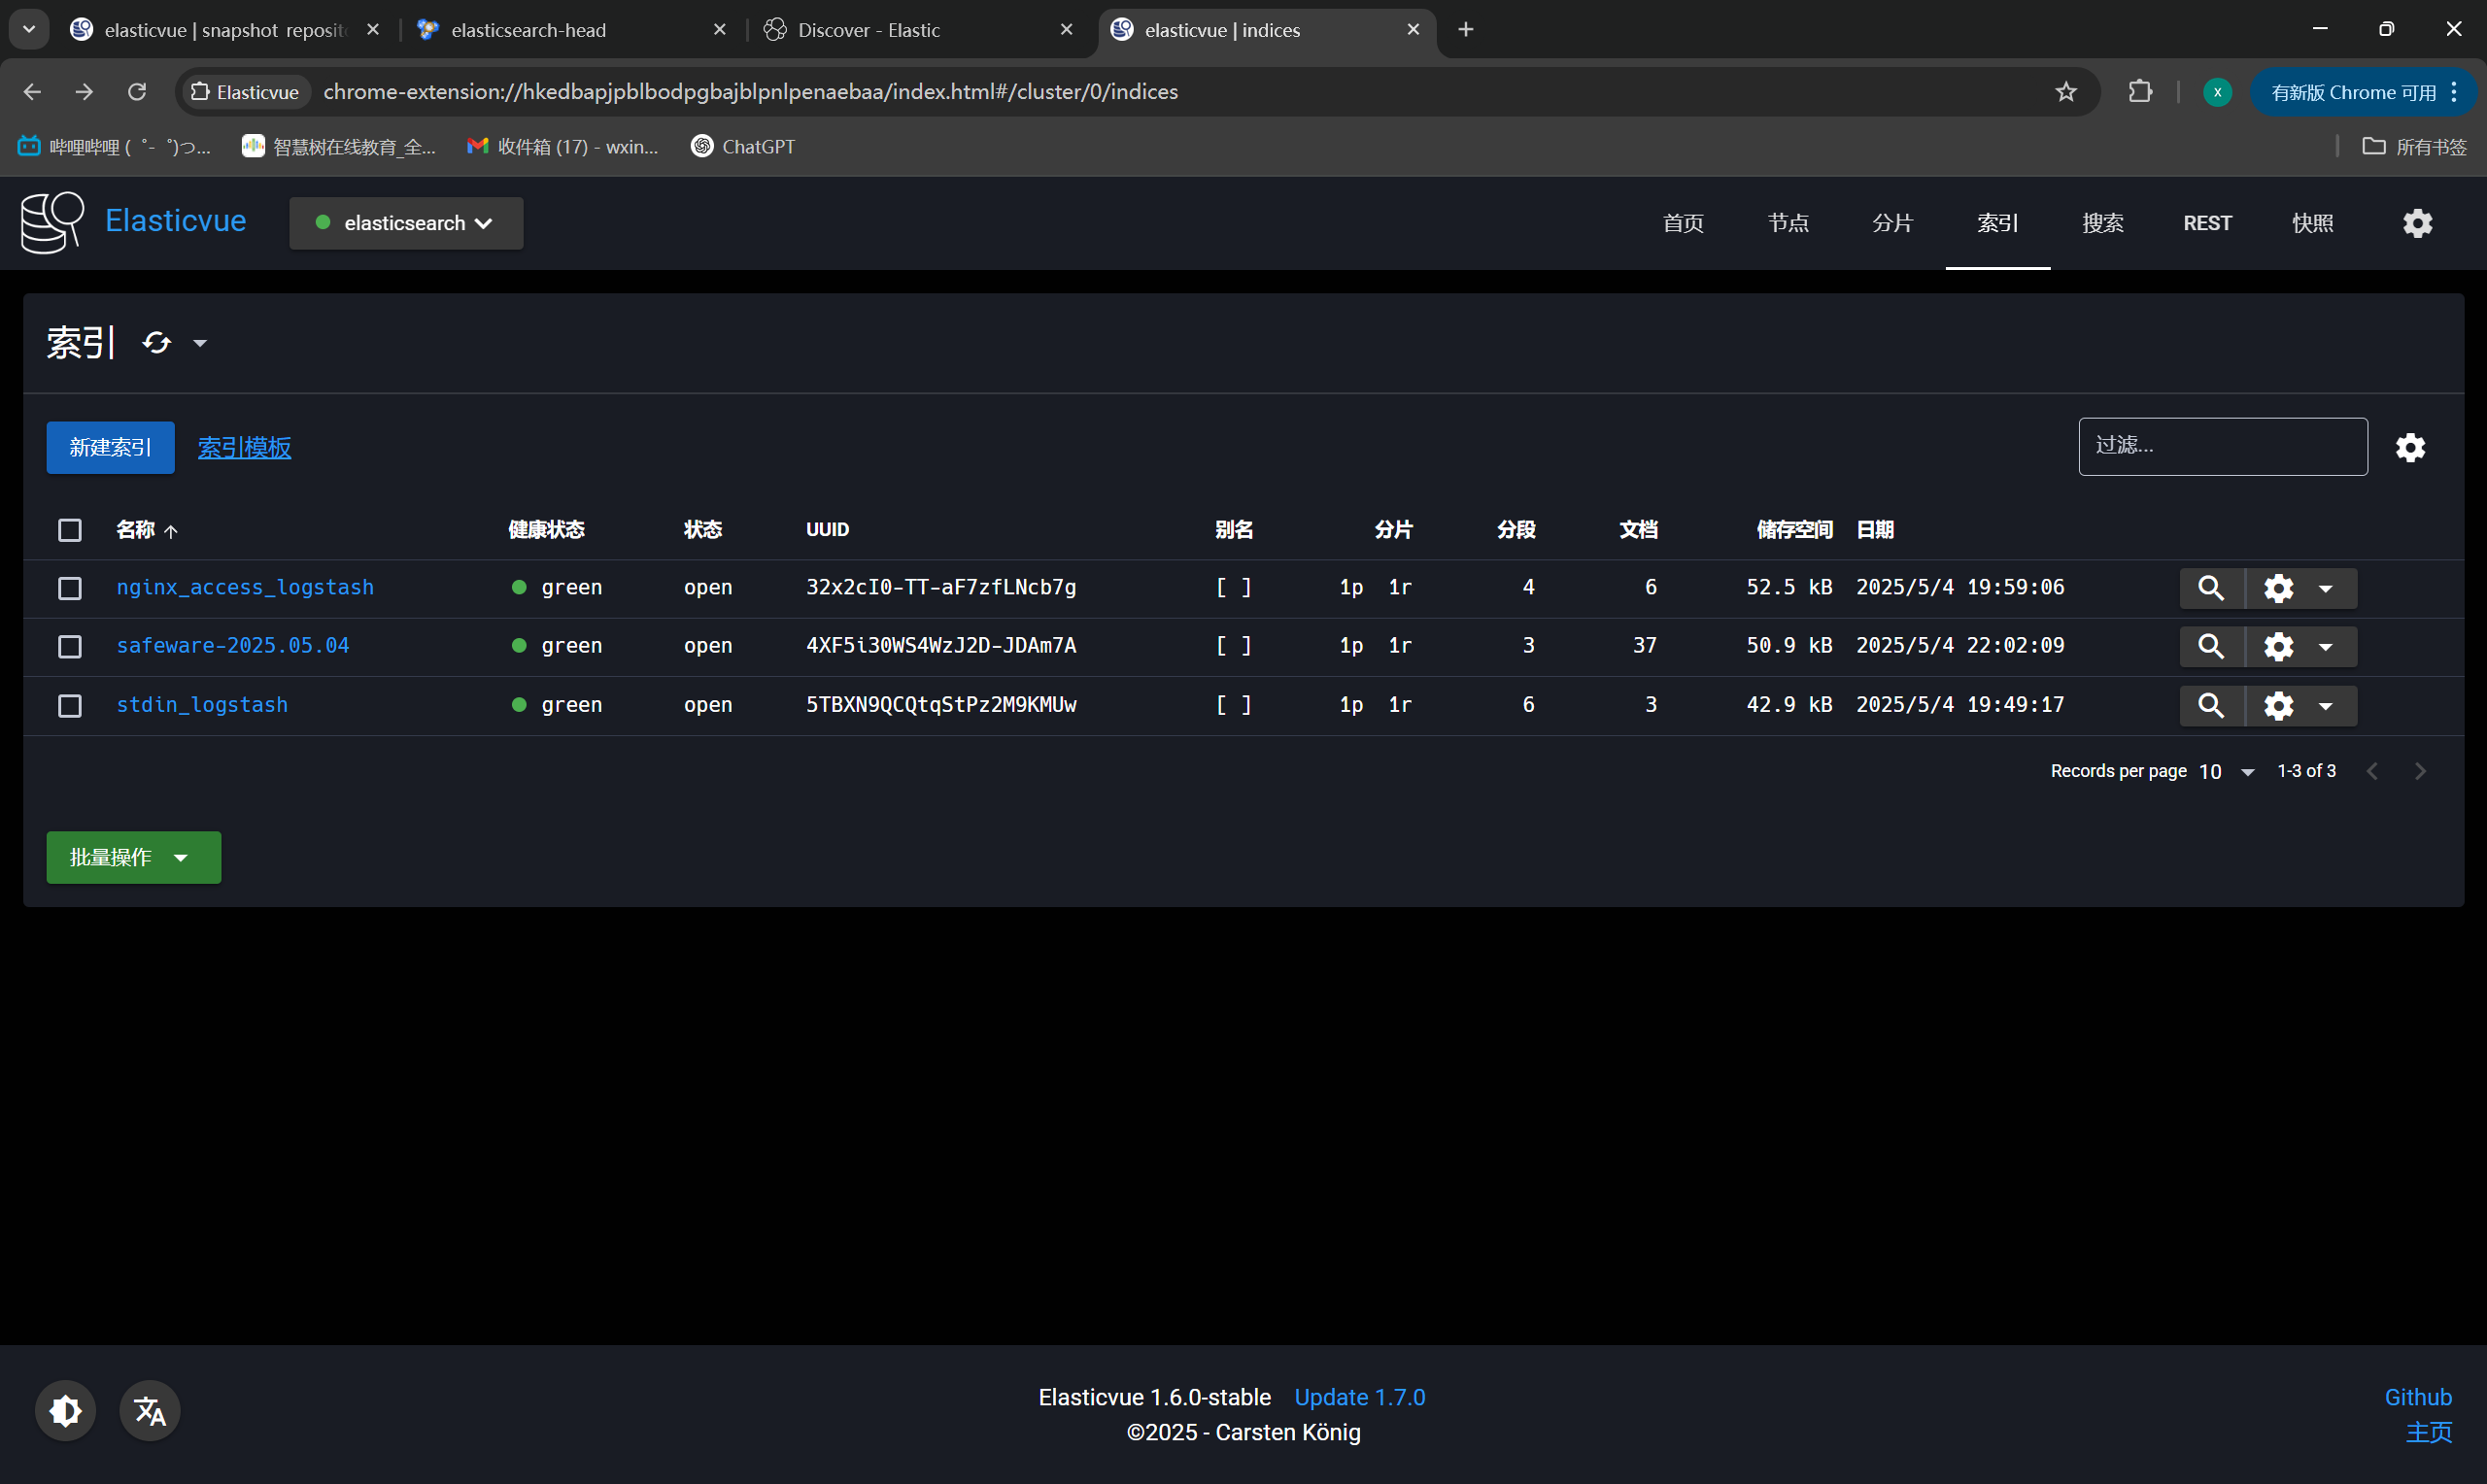
**输入来自日志多文件,输出到ES集群**
|
||
|
||
Logstash采集配置文件
|
||
|
||
```bash
|
||
[root@logstash ~]# vim /opt/files.conf
|
||
input {
|
||
file {
|
||
path => "/var/log/message"
|
||
type => "system"
|
||
start_position => "beginning"
|
||
}
|
||
}
|
||
input {
|
||
file {
|
||
path => "/var/log/yum.log"
|
||
type => "safeware"
|
||
start_position => "beginning"
|
||
}
|
||
}
|
||
output {
|
||
if [type] == 'system' {
|
||
elasticsearch {
|
||
index => "system-%{+YYYY.MM.dd}"
|
||
hosts => [ "https://192.168.159.131:9200" ]
|
||
cacert => "/usr/local/logstash/config/certs/elasticsearch-ca.pem"
|
||
user => "elastic"
|
||
password => "123456"
|
||
}
|
||
}
|
||
if [type] == 'safeware' {
|
||
elasticsearch {
|
||
index => "safeware-%{+YYYY.MM.dd}"
|
||
hosts => [ "https://192.168.159.131:9200" ]
|
||
cacert => "/usr/local/logstash/config/certs/elasticsearch-ca.pem"
|
||
user => "elastic"
|
||
password => "123456"
|
||
}
|
||
}
|
||
}
|
||
```
|
||
|
||
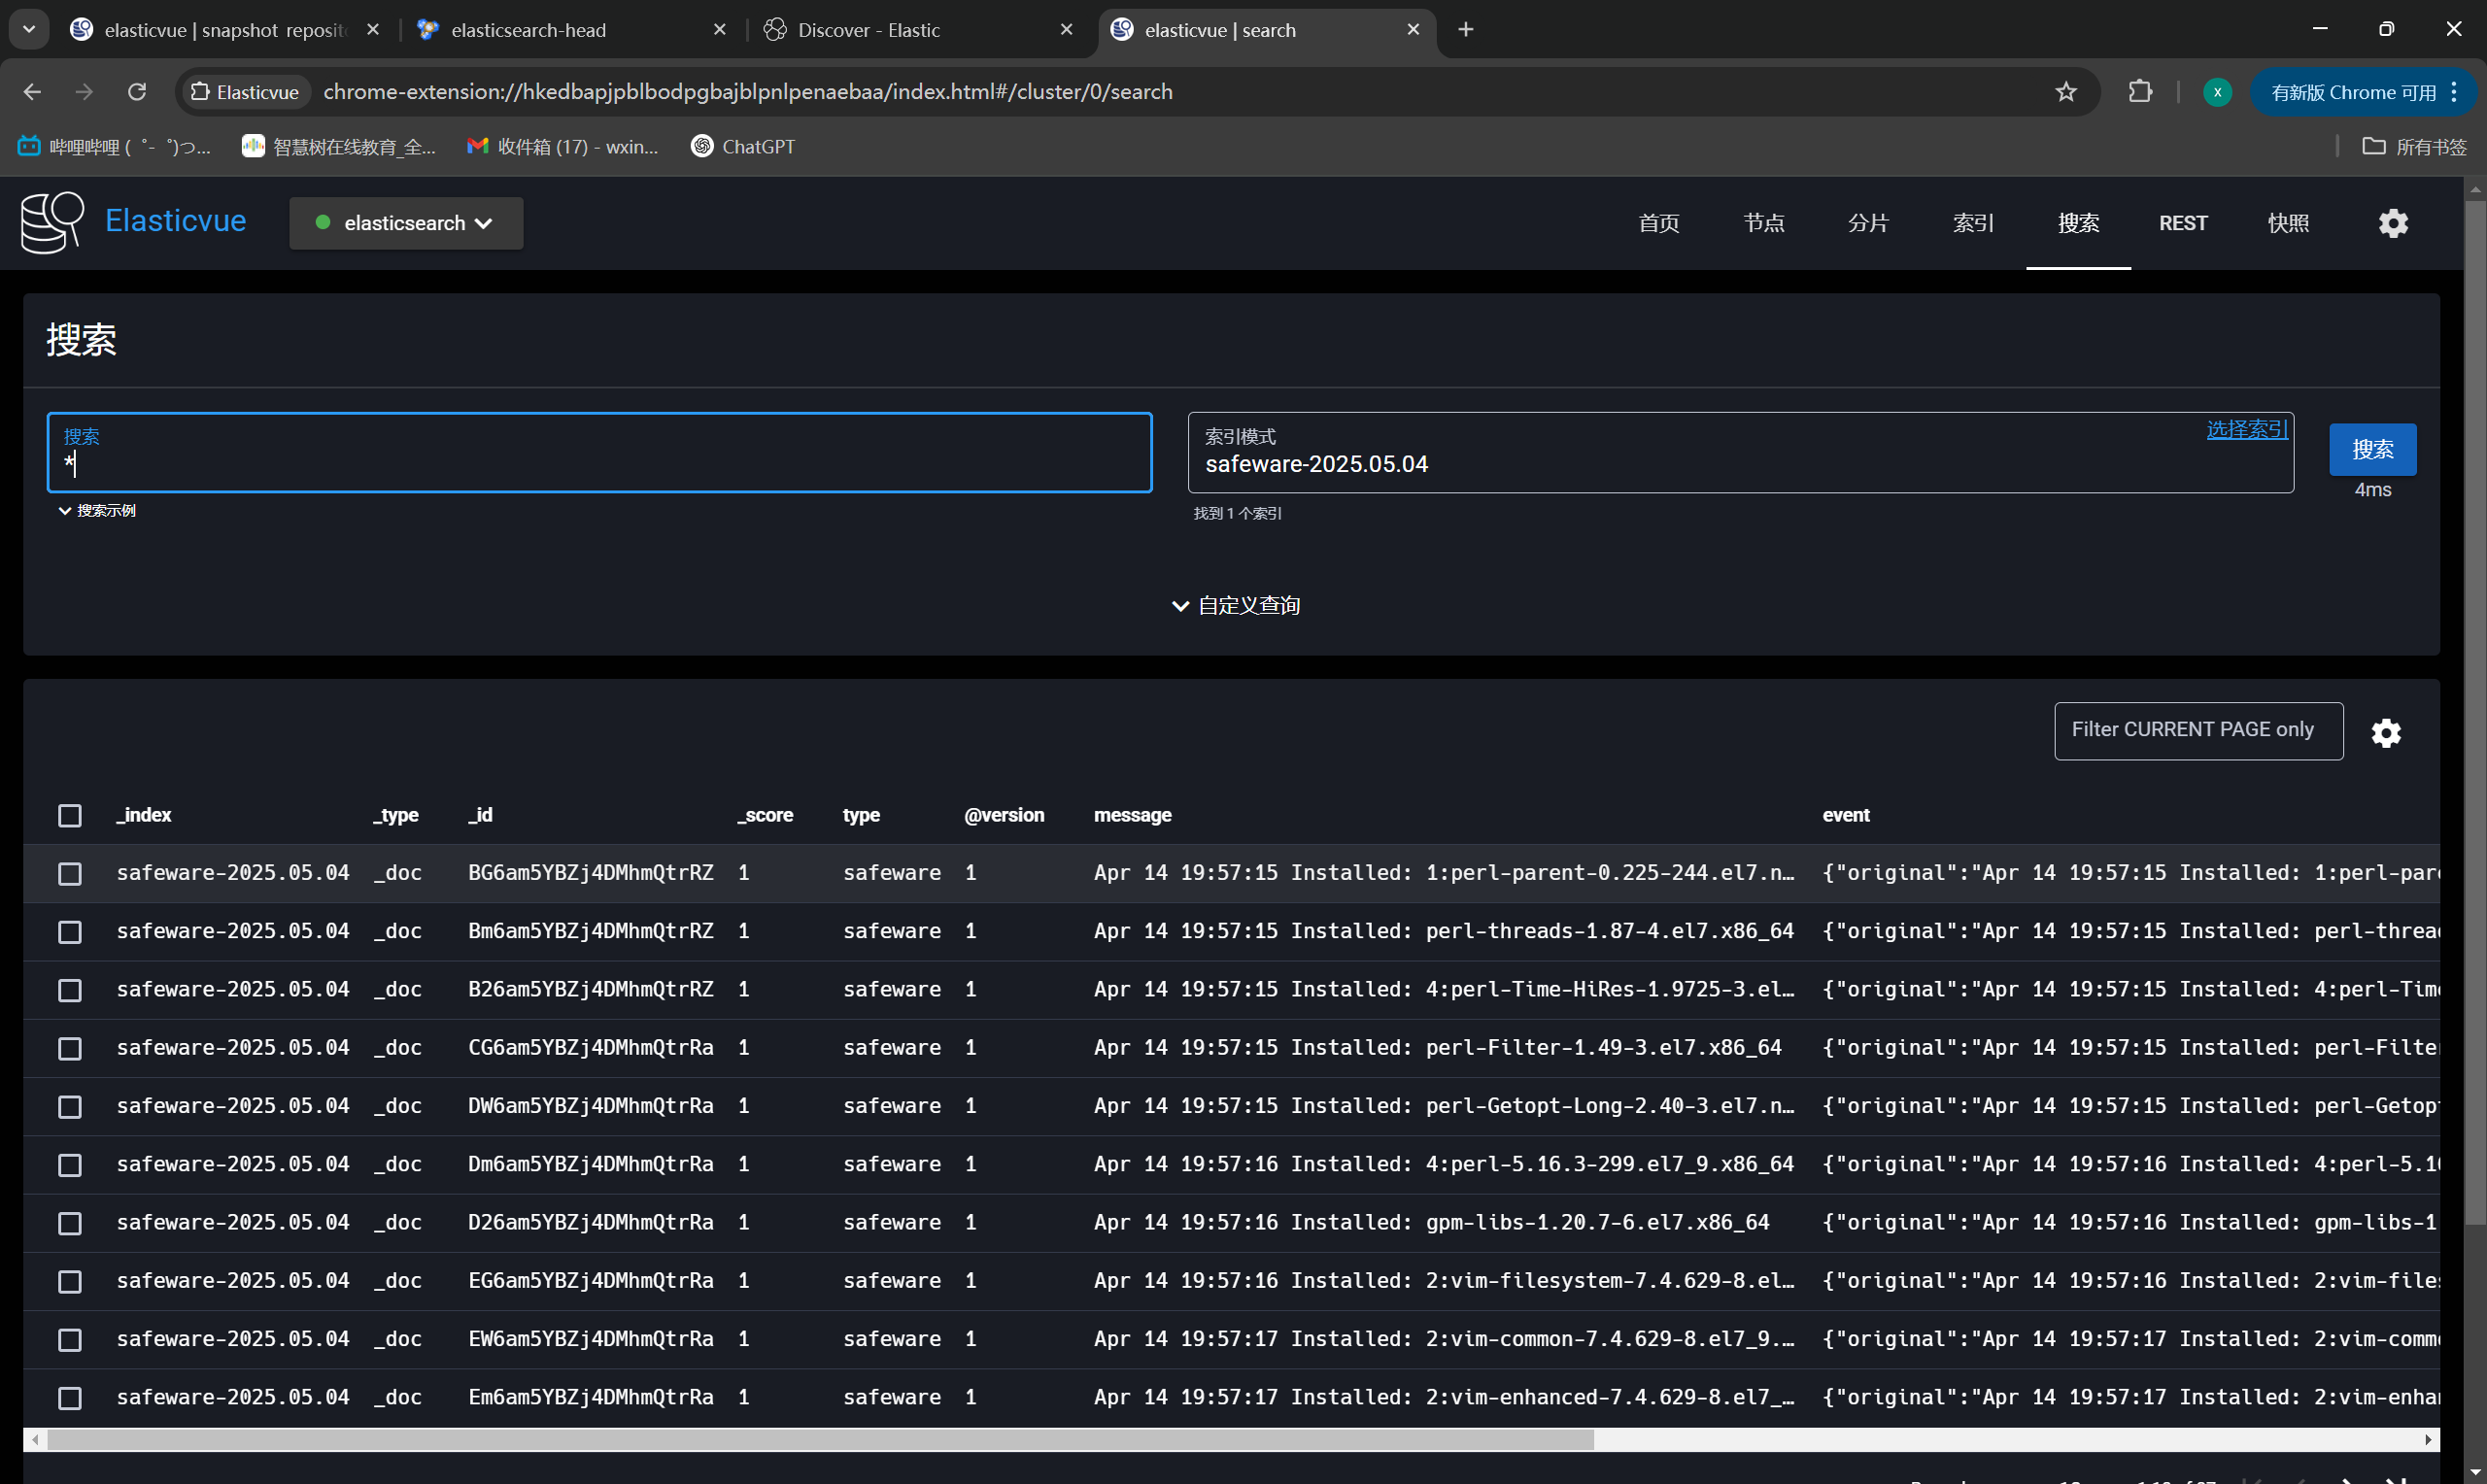
ES插件展示索引
|
||
|
||
|
||
|
||
|
||
|
||
## 三:数据过滤
|
||
|
||
### 1. 插件 grok 简介
|
||
|
||
- grok插件有非常强大的功能,他能匹配一切数据,但是他的性能和对资源的损耗同样让人诟病
|
||
- filter的grok是目前logstash中解析非结构化日志数据最好的方式
|
||
- grok位于正则表达式之上,所以任何正则表达式在grok中都是有效的
|
||
|
||
**官网地址:**
|
||
|
||
正则:https://github.com/logstash-plugins/logstash-patterns-core/blob/main/patterns/ecs-v1/grok-patterns
|
||
|
||
### 2. 语法格式
|
||
|
||
- Grok 模式的语法是:%{SYNTAX:SEMANTIC}
|
||
- 是`SYNTAX`将与您的文本匹配的模式的名称
|
||
- 是`SEMANTIC`您为匹配的文本片段指定的标识符
|
||
|
||
### 3. 应用案例
|
||
|
||
**针对nginx的访问日志,获取对应的IP地址**
|
||
|
||
Logstash采集数据配置文件:
|
||
|
||
```bash
|
||
[root@logstash ~]# vim /opt/grok_nginx_access_logstash.conf
|
||
input {
|
||
file {
|
||
path => "/var/log/nginx/access.log"
|
||
start_position => "beginning"
|
||
}
|
||
}
|
||
filter {
|
||
grok {
|
||
match => {
|
||
"message" => "%{IP:remote_addr}"
|
||
}
|
||
}
|
||
}
|
||
output {
|
||
elasticsearch {
|
||
index => "grok_nginx_access_logstash"
|
||
hosts => [ "https://192.168.159.131:9200" ]
|
||
cacert => "/usr/local/logstash/config/certs/elasticsearch-ca.pem"
|
||
user => "elastic"
|
||
password => "123456"
|
||
}
|
||
}
|
||
```
|
||
|
||
执行:
|
||
|
||
```bash
|
||
[root@logstash ~]# /usr/local/logstash/bin/logstash -f /opt/grok_nginx_access_logstash.conf
|
||
```
|
||
|
||
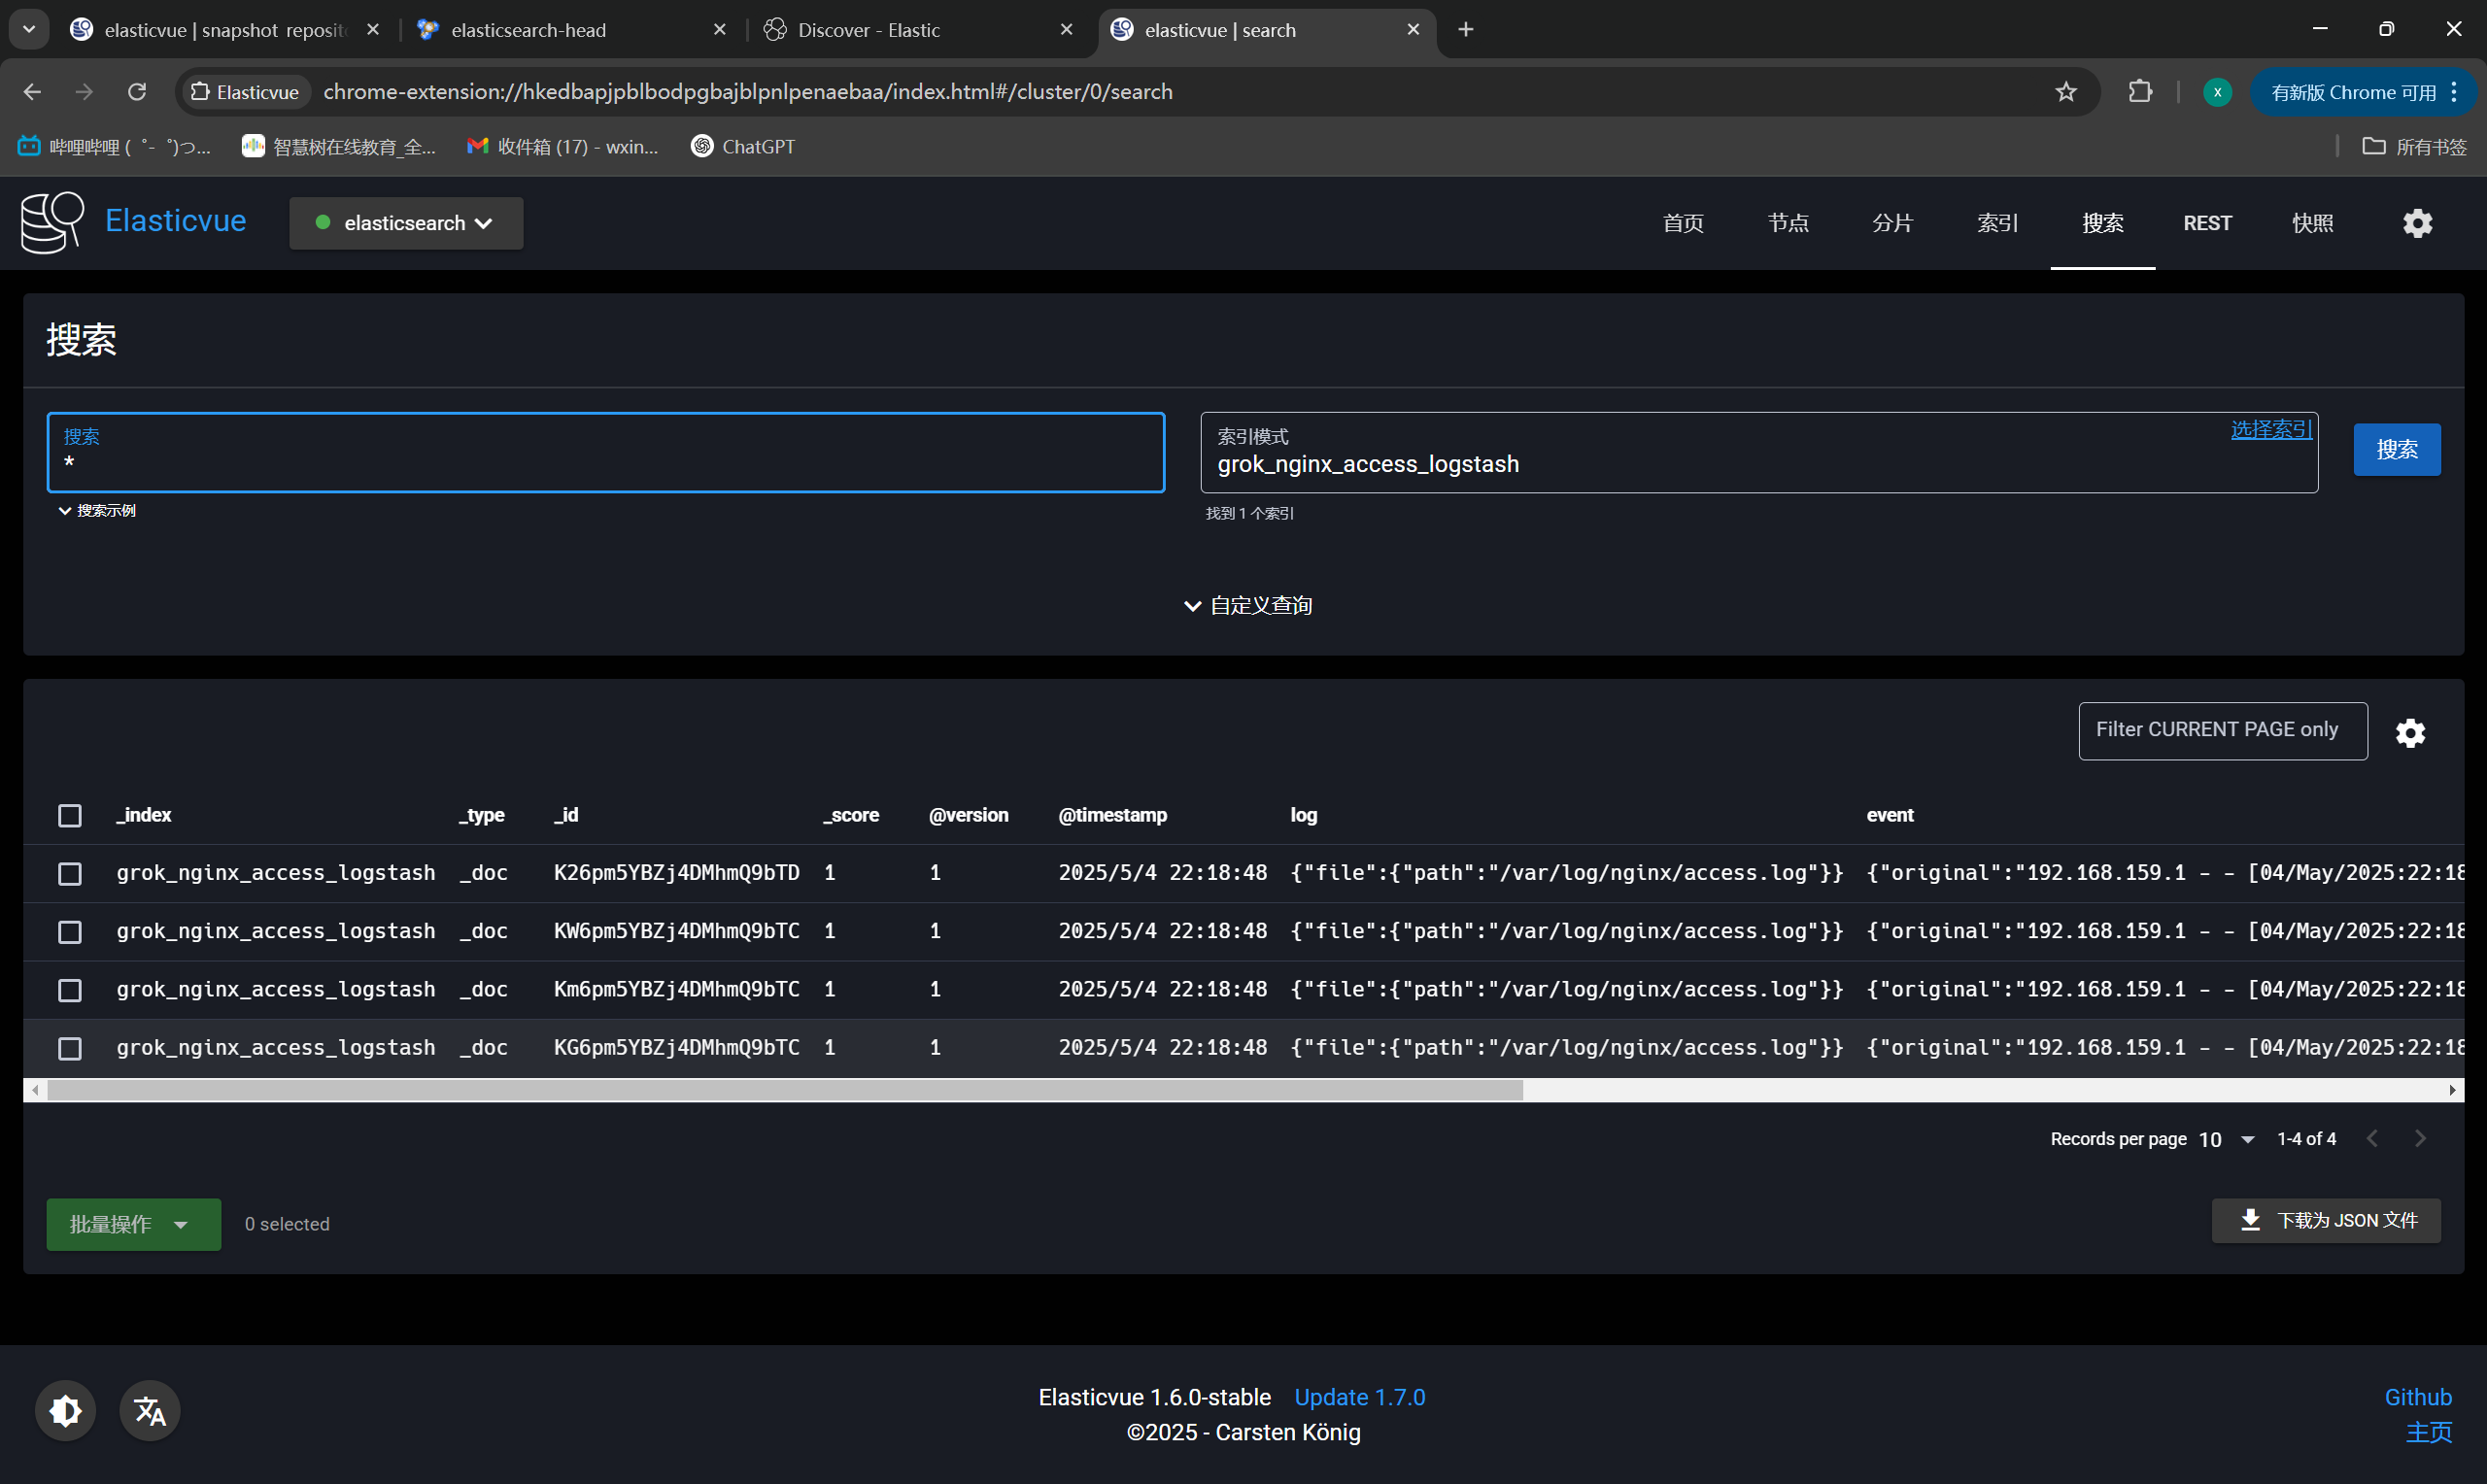
ES插件确认索引:
|
||
|
||
|
||
|
||
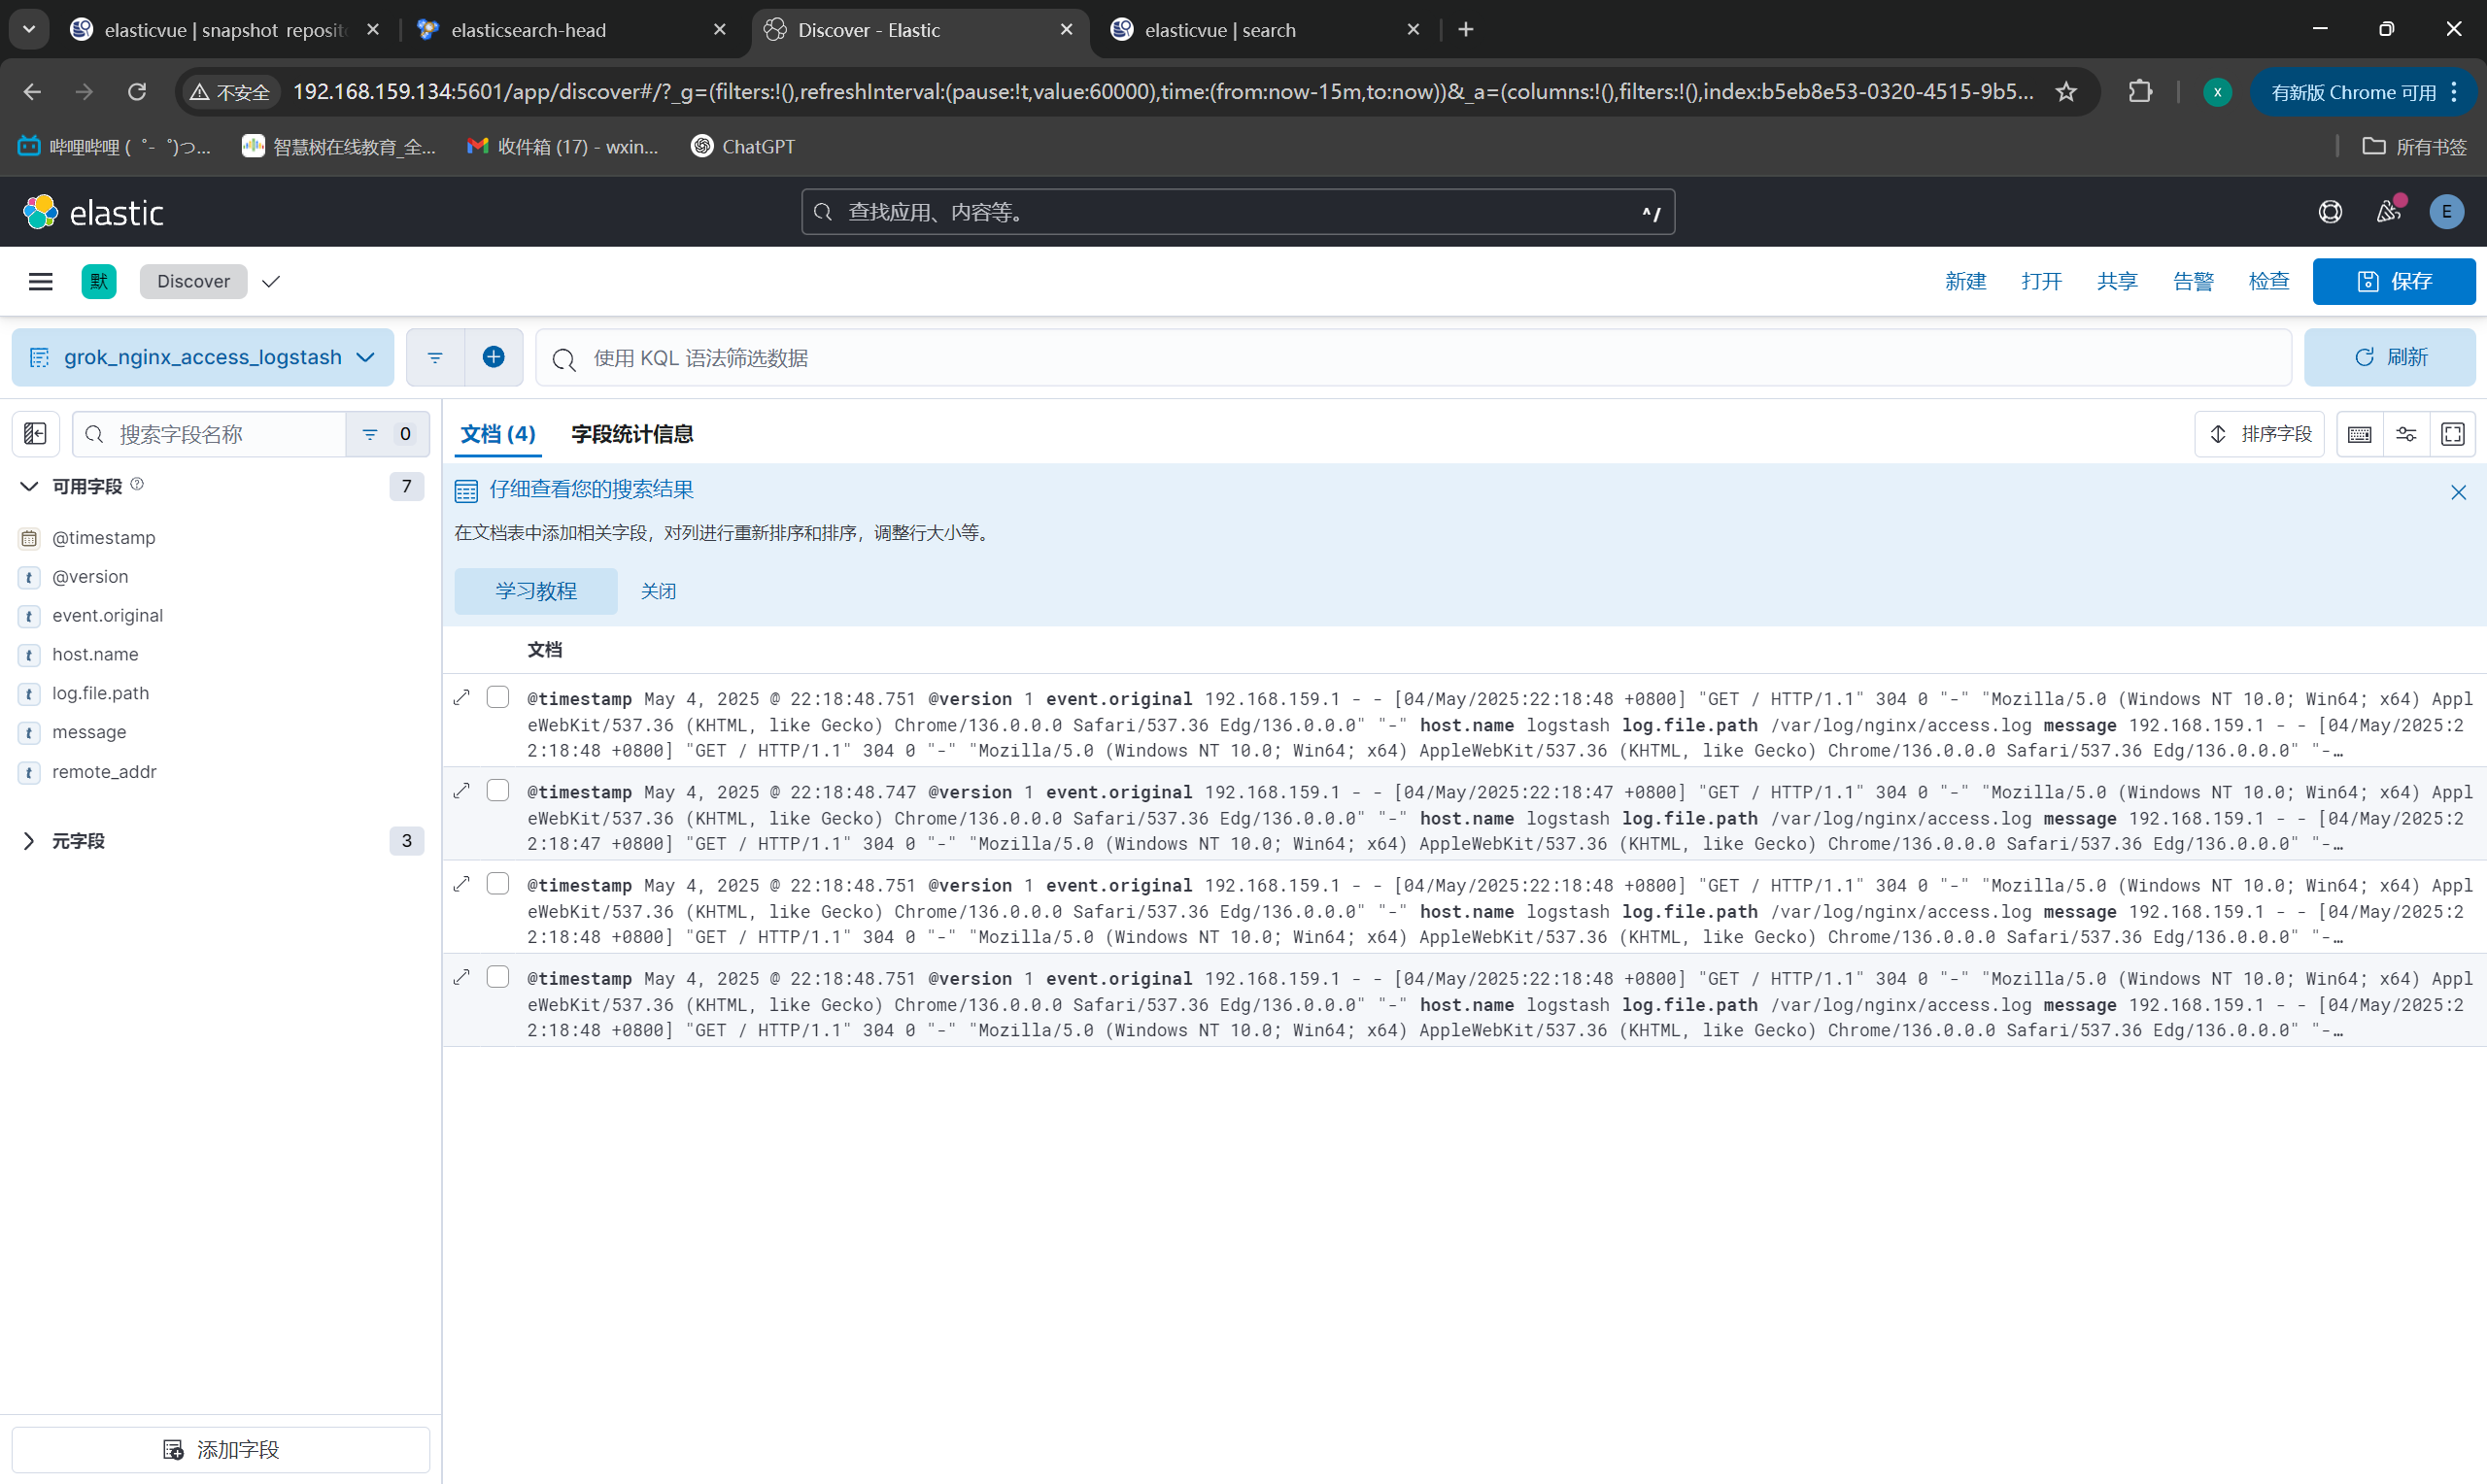
Kibana查看新字段:
|
||
|
||
|
||
|
||
**针对nginx的访问日志,对应生成新的字段**
|
||
|
||
Logstash采集数据配置文件:
|
||
|
||
```bash
|
||
[root@logstash ~]# vim /opt/grok_nginx_access_logstash.conf
|
||
input {
|
||
file {
|
||
path => "/var/log/nginx/access.log"
|
||
start_position => "beginning"
|
||
}
|
||
}
|
||
filter {
|
||
grok {
|
||
match => {
|
||
"message" => "%{IPORHOST:client_ip} - %{DATA:user} \[%{HTTPDATE:timestamp}\] \"%{WORD:method} %{DATA:request} HTTP/%{NUMBER:httpversion}\" %{NUMBER:response_code} %{NUMBER:bytes_sent} \"%{DATA:referrer}\" \"%{DATA:user_agent}\""
|
||
}
|
||
}
|
||
date {
|
||
match => [ "timestamp", "dd/MM/YYYY:HH:mm:ss Z" ]
|
||
}
|
||
}
|
||
output {
|
||
elasticsearch {
|
||
index => "grok_nginx_access_logstash"
|
||
hosts => [ "https://192.168.159.131:9200" ]
|
||
cacert => "/usr/local/logstash/config/certs/elasticsearch-ca.pem"
|
||
user => "elastic"
|
||
password => "123456"
|
||
}
|
||
}
|
||
```
|
||
|
||
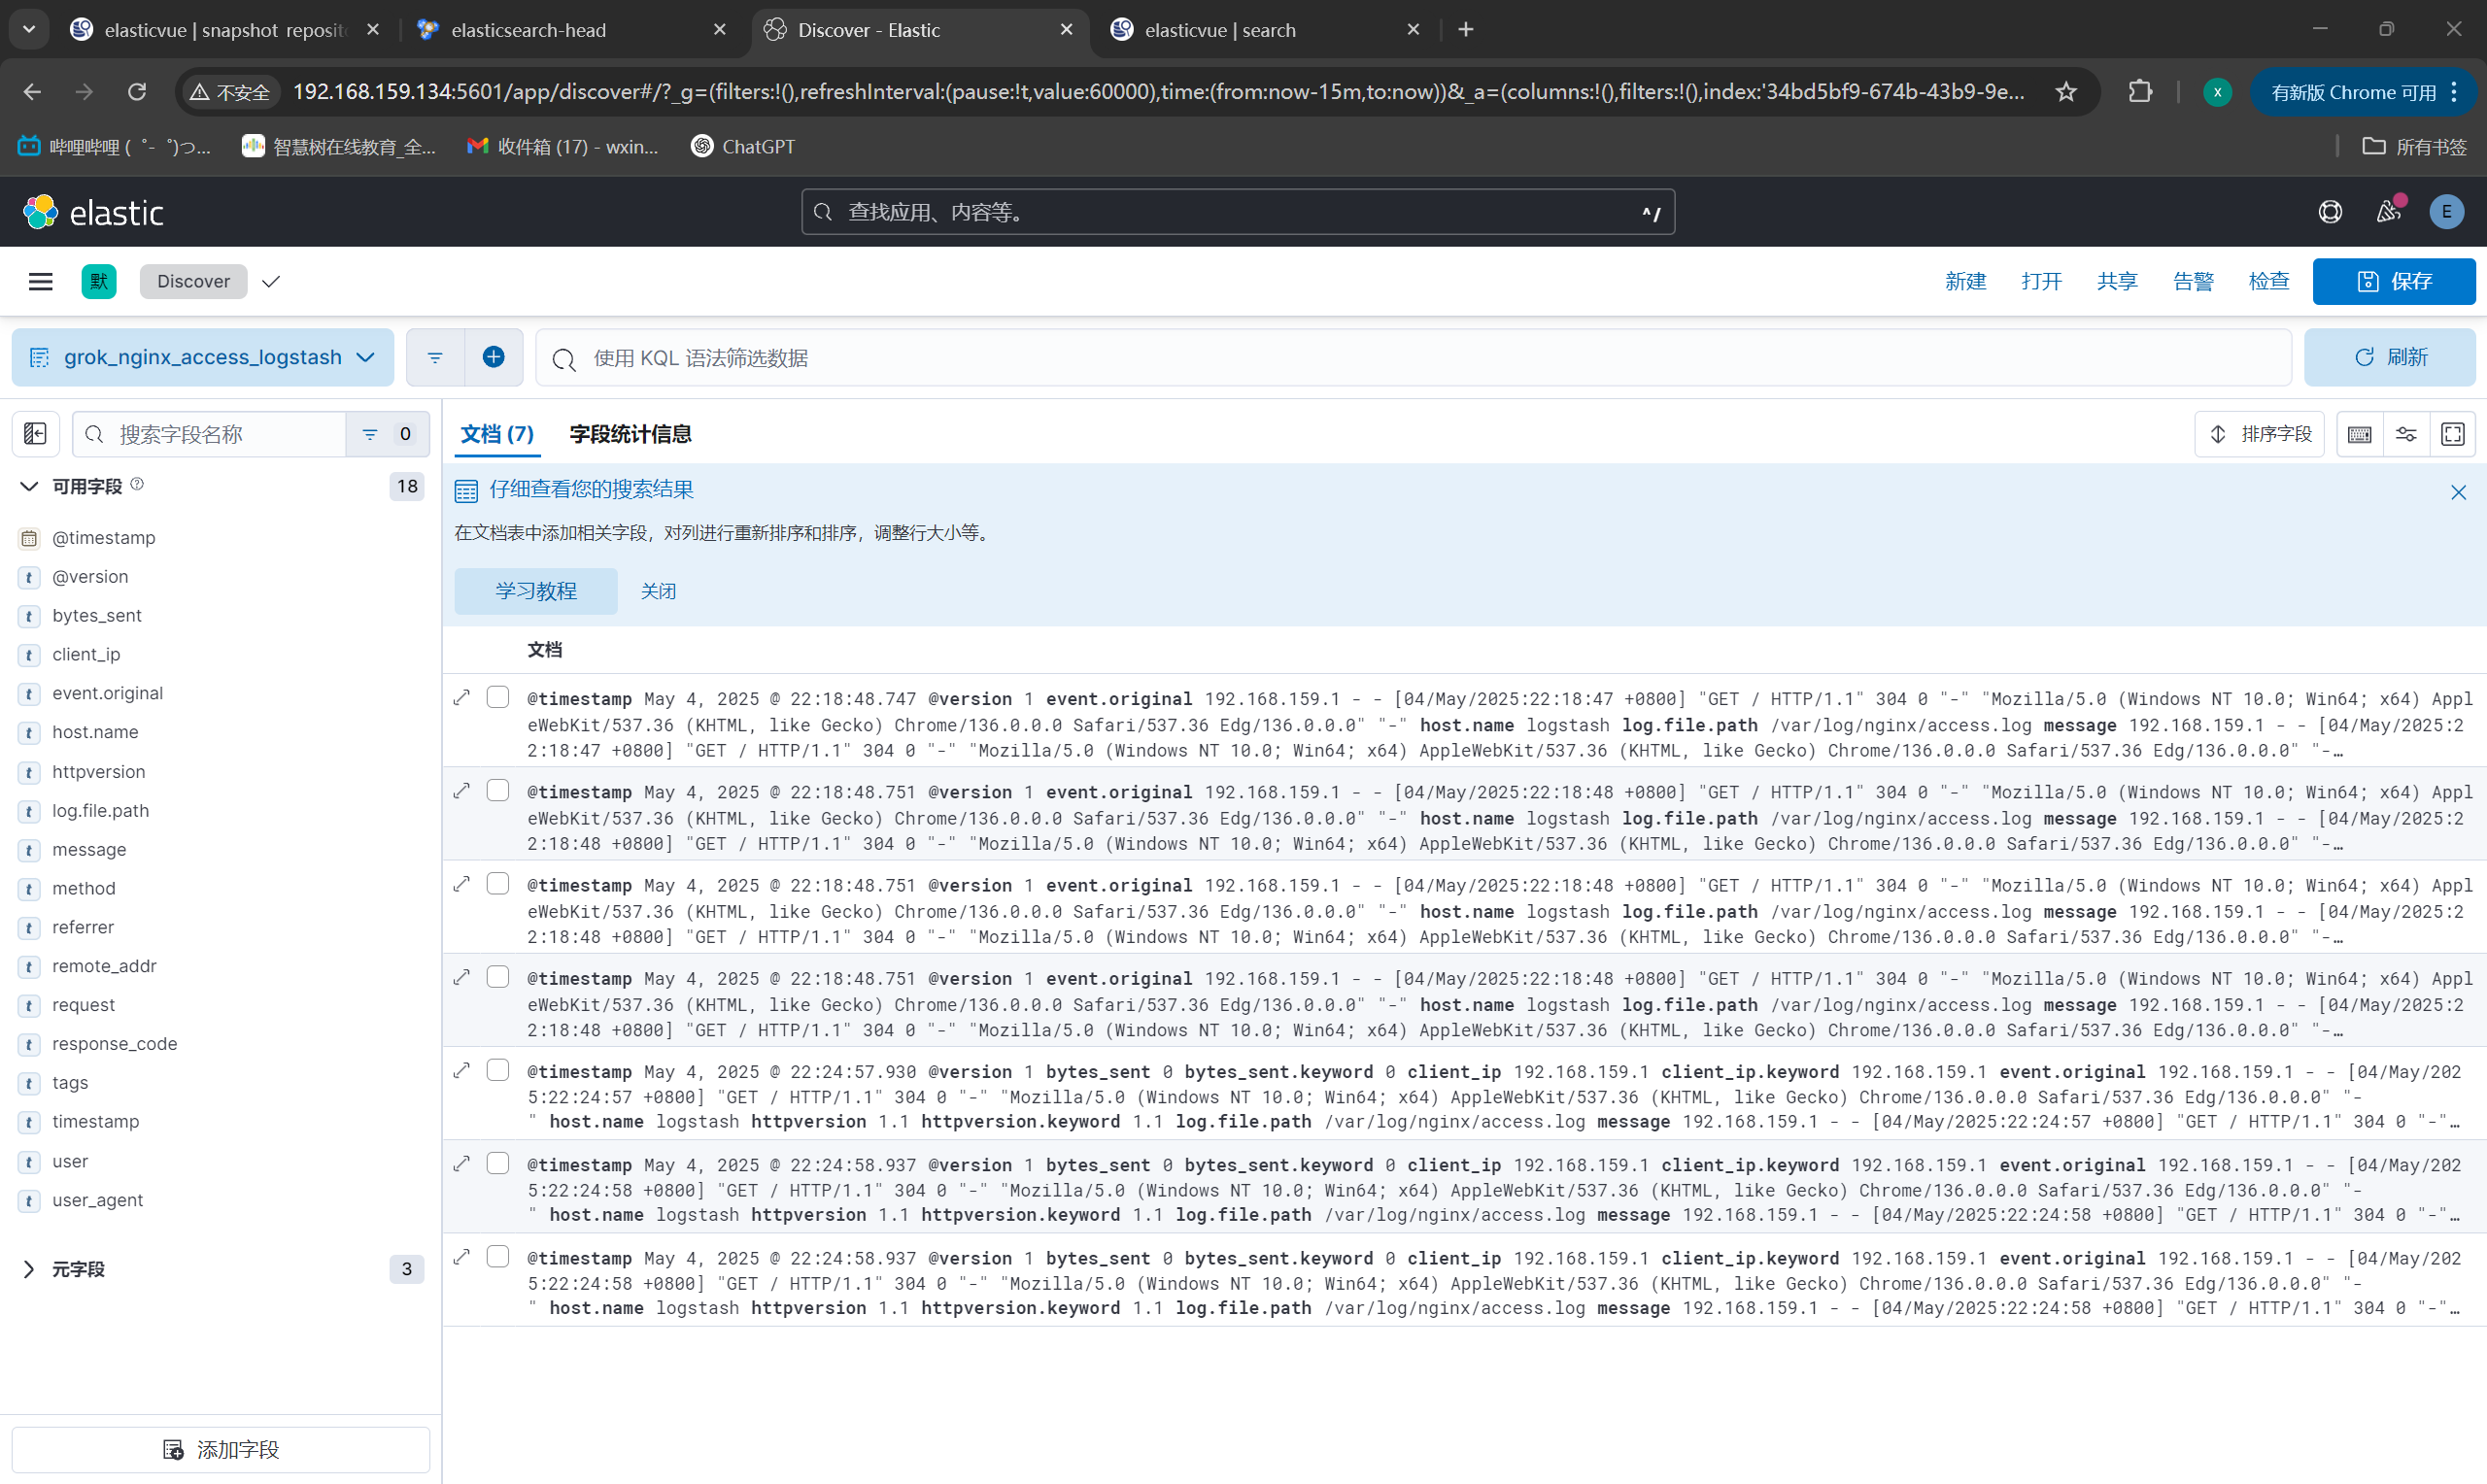
Kibana查看新字段:
|
||
|
||
 |