165 lines
5.2 KiB
Markdown
165 lines
5.2 KiB
Markdown
<h2><center>Kibana</center></h2>
|
||
|
||
------
|
||
|
||
|
||
|
||
## 一:基本概念
|
||
|
||
### 1. Kibana 简介
|
||
|
||
Kibana 是一个开源的数据分析和可视化平台,它是 Elastic Stack(包括 Elasticsearch、Logstash、Kibana 和 Beats)的一部分,主要用于对 Elasticsearch 中的数据进行搜索、查看、交互操作。
|
||
|
||
### 2. Kibana 功能
|
||
|
||
- 数据可视化:Kibana 提供了丰富的数据可视化选项,如柱状图、线图等,帮助用户以图形化的方式理解数据
|
||
- 数据探索:Kibana 提供了强大的数据探索功能,用户可以通过 Kibana 的界面进行数据筛选和排序
|
||
- 仪表盘:用户可以将多个可视化组件组合在一起,创建交互式的仪表盘,用于实时监控数据
|
||
- 机器学习:Kibana 还集成了 Elasticsearch 的机器学习功能,可以用于异常检测、预测等任务
|
||
- 定制和扩展:Kibana 提供了丰富的 API 和插件系统,用户可以根据自己的需求定制和扩展 Kibana
|
||
|
||
## 二:安装部署
|
||
|
||
### 1. 获取安装包
|
||
|
||
对应Elasticsearch版本获取Kibana的安装包
|
||
|
||
官网获取:[Past Releases of Elastic Stack Software | Elastic](https://www.elastic.co/downloads/past-releases#kibana)
|
||
|
||
```bash
|
||
[root@kibana ~]# wget https://artifacts.elastic.co/downloads/kibana/kibana-8.13.4-linux-x86_64.tar.gz
|
||
```
|
||
|
||
### 2. 安装部署
|
||
|
||
```bash
|
||
[root@kibana ~]# tar xf kibana-8.13.4-linux-x86_64.tar.gz -C /usr/local/
|
||
[root@kibana ~]# mv /usr/local/kibana-8.13.4/ /usr/local/kibana
|
||
[root@kibana ~]# mkdir /usr/local/kibana/config/certs
|
||
```
|
||
|
||
### 3. 修改配置
|
||
|
||
```bash
|
||
[root@kibana ~]# vim /usr/local/kibana/config/kibana.yml
|
||
server.port: 5601
|
||
server.host: "192.168.159.134"
|
||
server.name: "kibana"
|
||
elasticsearch.hosts: ["https://192.168.159.131:9200"]
|
||
elasticsearch.username: "kibana"
|
||
elasticsearch.password: "123456"
|
||
elasticsearch.ssl.certificateAuthorities: [ "/usr/local/kibana/config/certs/elasticsearch-ca.pem" ]
|
||
i18n.locale: "zh-CN"
|
||
```
|
||
|
||
### 4. 获取Elasticsearch 的CA证书
|
||
|
||
```bash
|
||
[root@kibana ~]# scp 192.168.159.131:/usr/local/elasticsearch/config/certs/elasticsearch-ca.pem /usr/local/kibana/config/certs/
|
||
```
|
||
|
||
### 5. 创建运行用户
|
||
|
||
```bash
|
||
[root@kibana ~]# useradd kibana
|
||
[root@kibana ~]# echo kibana | passwd --stdin kibana
|
||
[root@kibana ~]# chown -R kibana:kibana /usr/local/kibana/
|
||
```
|
||
|
||
### 6. 启动Kibana
|
||
|
||
```bash
|
||
[root@kibana ~]# su - kibana
|
||
[kibana@kibana ~]$ /usr/local/kibana/bin/kibana
|
||
```
|
||
|
||
### 7. 常见故障
|
||
|
||
```bash
|
||
Error: [config validation of [elasticsearch].username]: value of "elastic" is forbidden. This is a superuser account that cannot write to system indices that Kibana needs to function. Use a service account token instead. Learn more: https://www.elastic.co/guide/en/elasticsearch/reference/8.0/service-accounts.html
|
||
at ensureValidConfiguration (/usr/local/kibana/node_modules/@kbn/core-config-server-internal/src/ensure_valid_configuration.js:23:11)
|
||
```
|
||
|
||
解决方案:
|
||
|
||
该版本的kibana在连接es集群中,不支持使用elasticsearch中elastic(超级管理员)账户连接
|
||
|
||
在es集群中自带的kibana账户设定密码
|
||
|
||
```bash
|
||
[elasticsearch@elasticsearch1 ~]$ /usr/local/elasticsearch/bin/elasticsearch-reset-password -u kibana -i
|
||
warning: ignoring JAVA_HOME=/usr/local/elasticsearch/jdk; using bundled JDK
|
||
This tool will reset the password of the [kibana] user.
|
||
You will be prompted to enter the password.
|
||
Please confirm that you would like to continue [y/N]y
|
||
|
||
|
||
Enter password for [kibana]:
|
||
Re-enter password for [kibana]:
|
||
Password for the [kibana] user successfully reset.
|
||
```
|
||
|
||
扩展:
|
||
|
||
Elasticsearch中创建用户
|
||
|
||
```bash
|
||
[elasticsearch@elasticsearch1 ~]$ /usr/local/elasticsearch/bin/elasticsearch-users useradd test_account
|
||
```
|
||
|
||
为用户分配角色
|
||
|
||
```bash
|
||
[elasticsearch@elasticsearch1 ~]$ /usr/local/elasticsearch/bin/elasticsearch-users roles -a superuser test_account
|
||
```
|
||
|
||
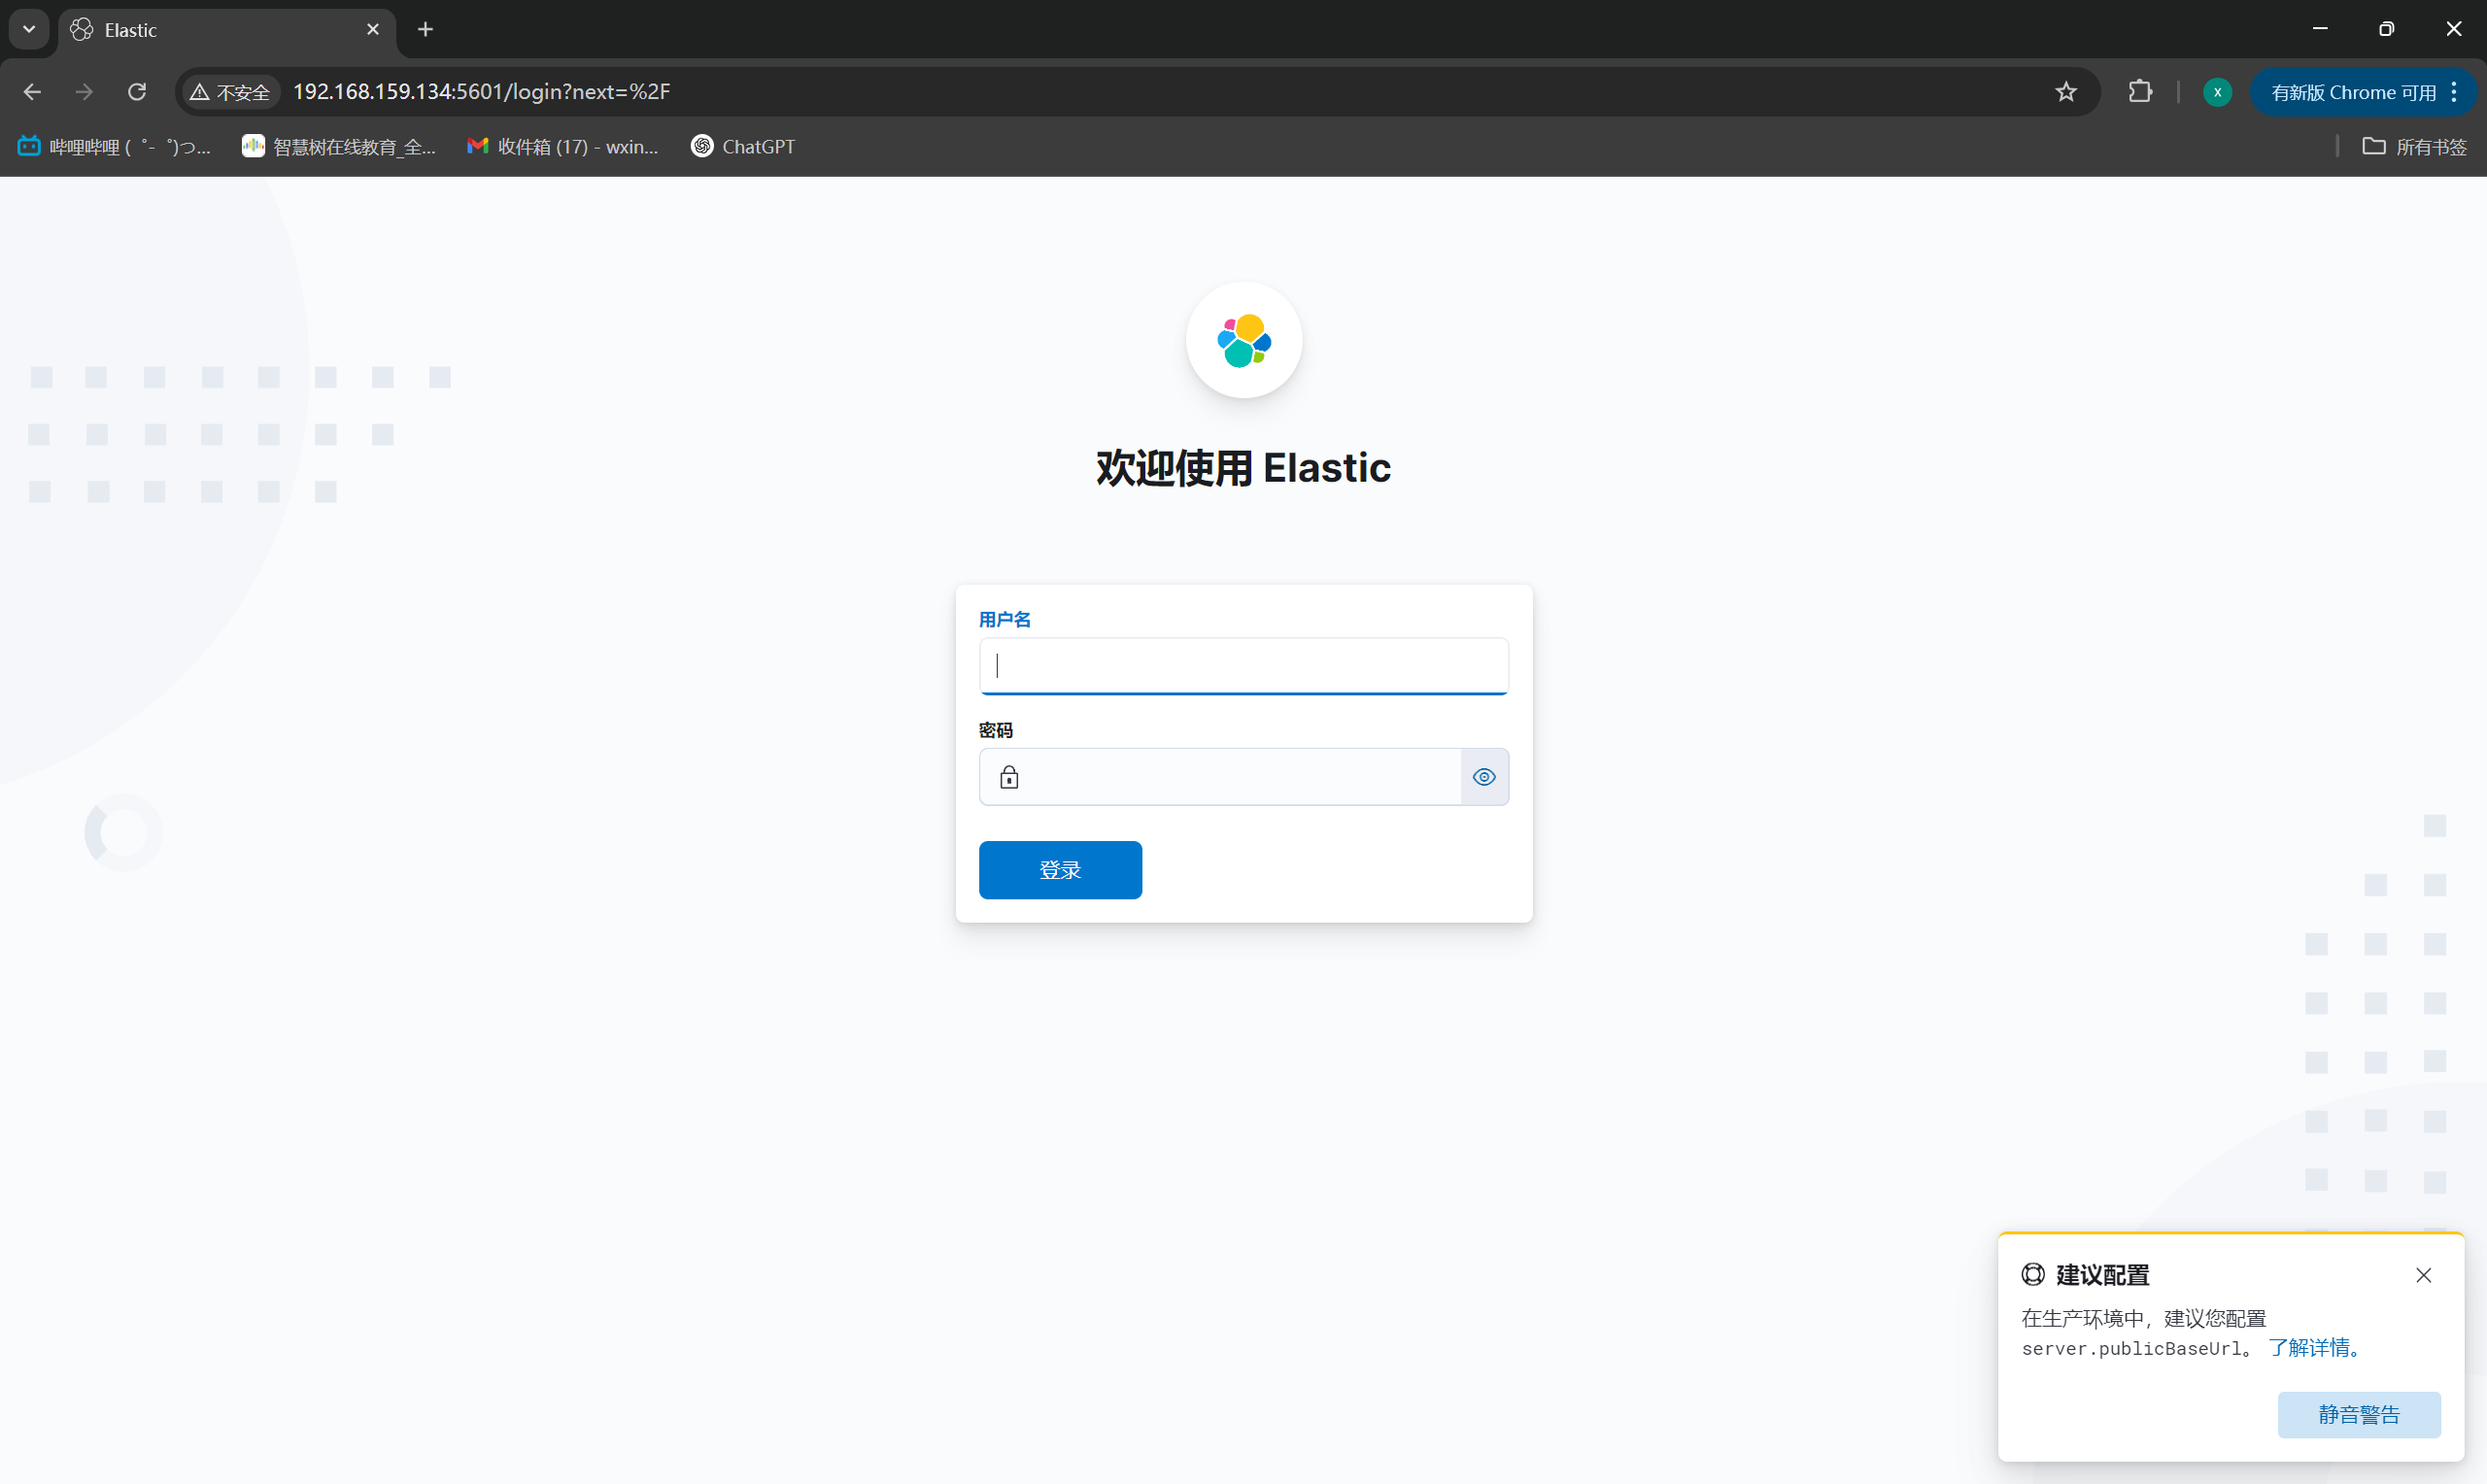
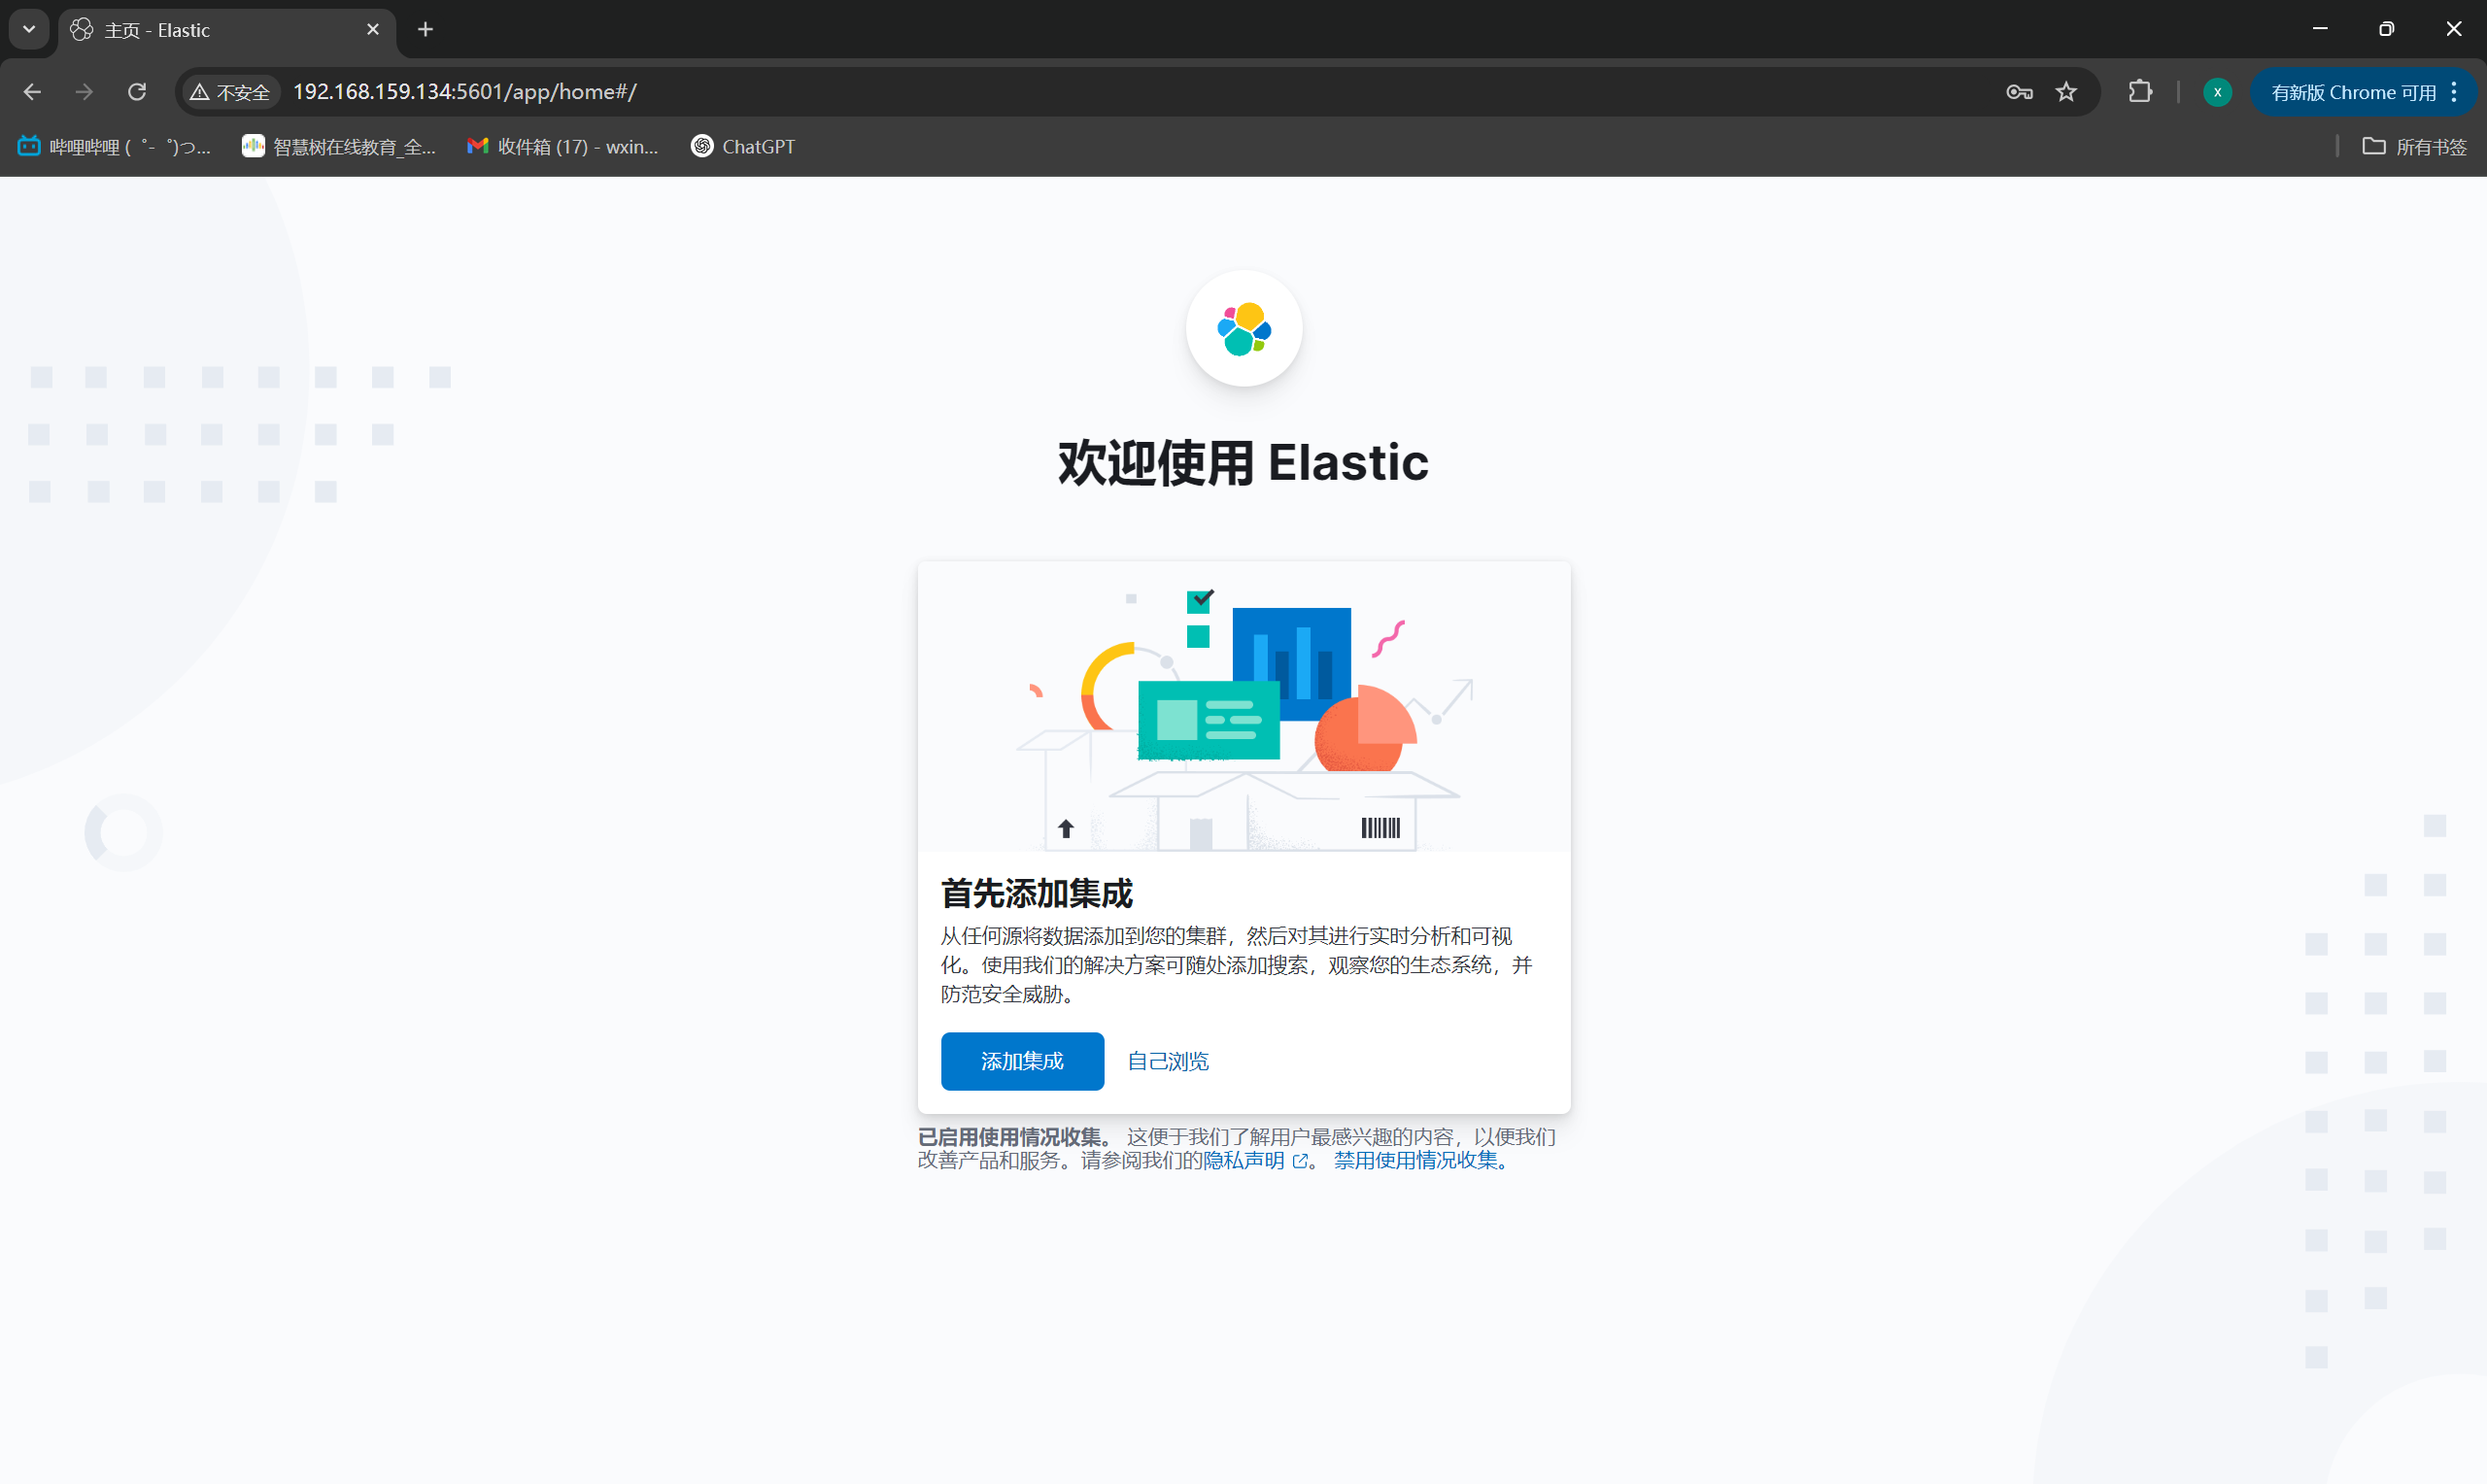
### 8. 浏览器访问
|
||
|
||
|
||
|
||
注意:
|
||
|
||
用户名和密码是es集群登录的用户和密码
|
||
|
||
|
||
|
||
|
||
|
||
## 三:配置使用
|
||
|
||
注意:此部分的使用在做完《Logstash》中第一节和第二节后在使用
|
||
|
||
### 1. Logstash采集到数据进行展示
|
||
|
||
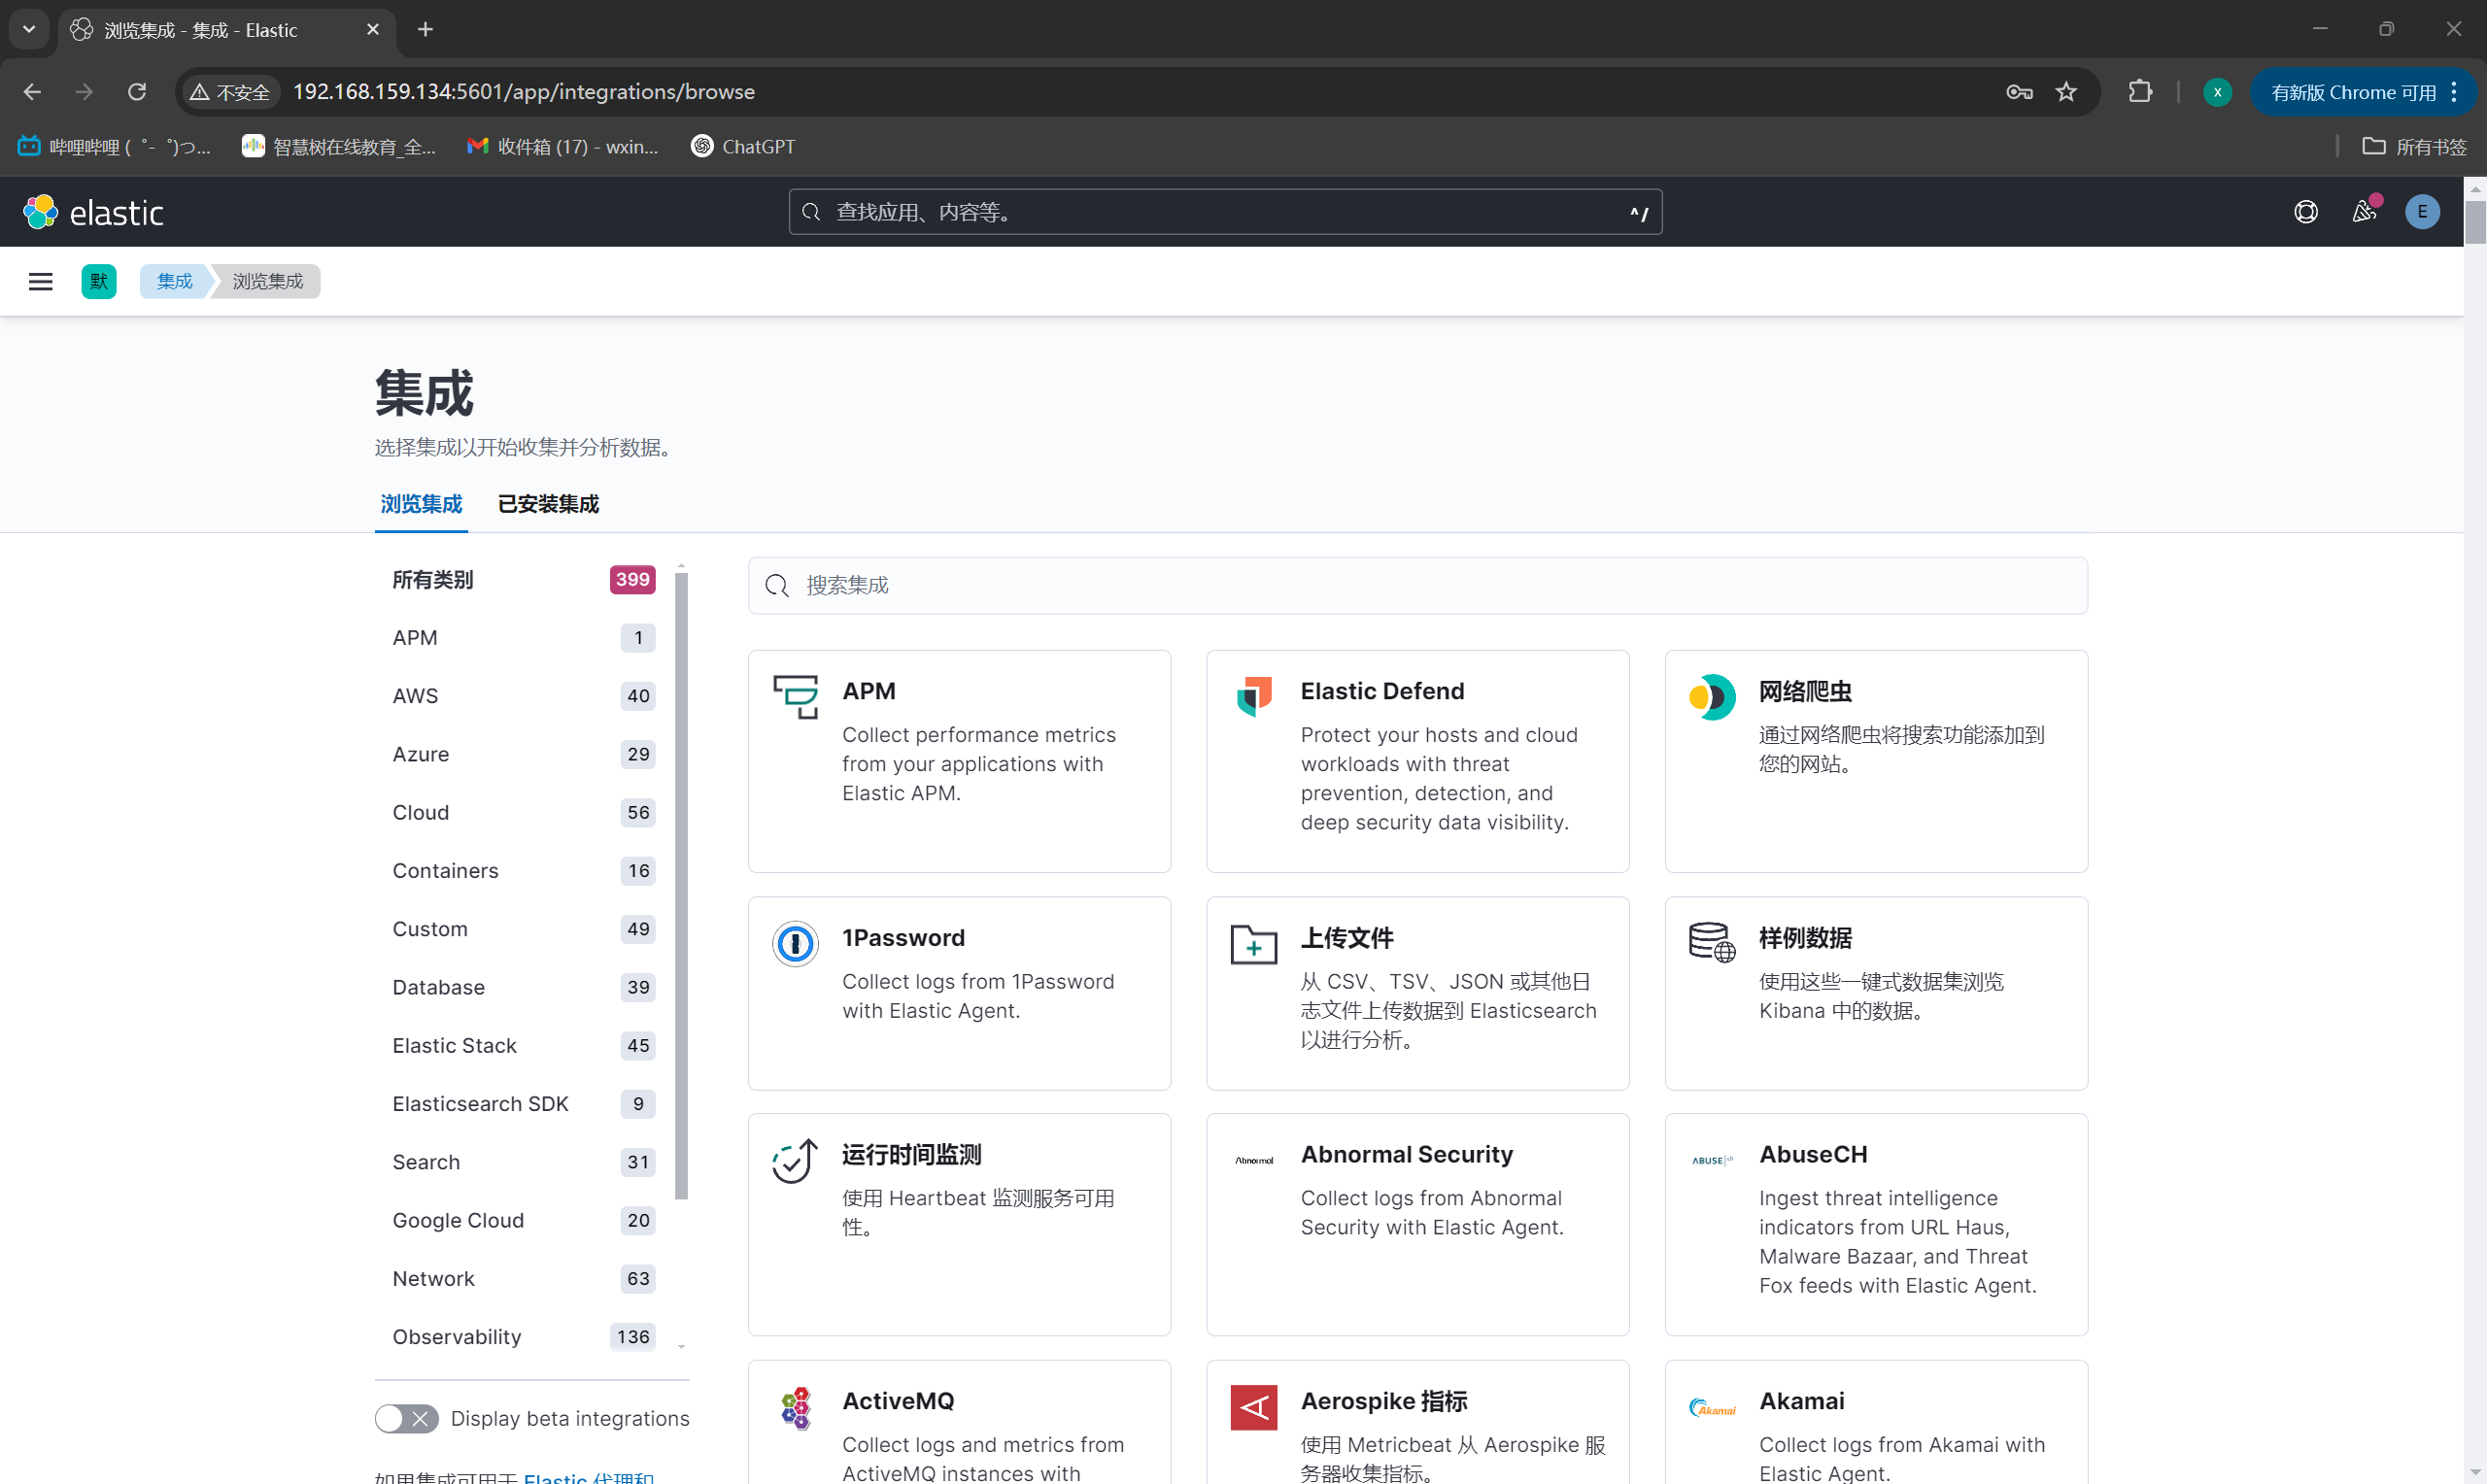
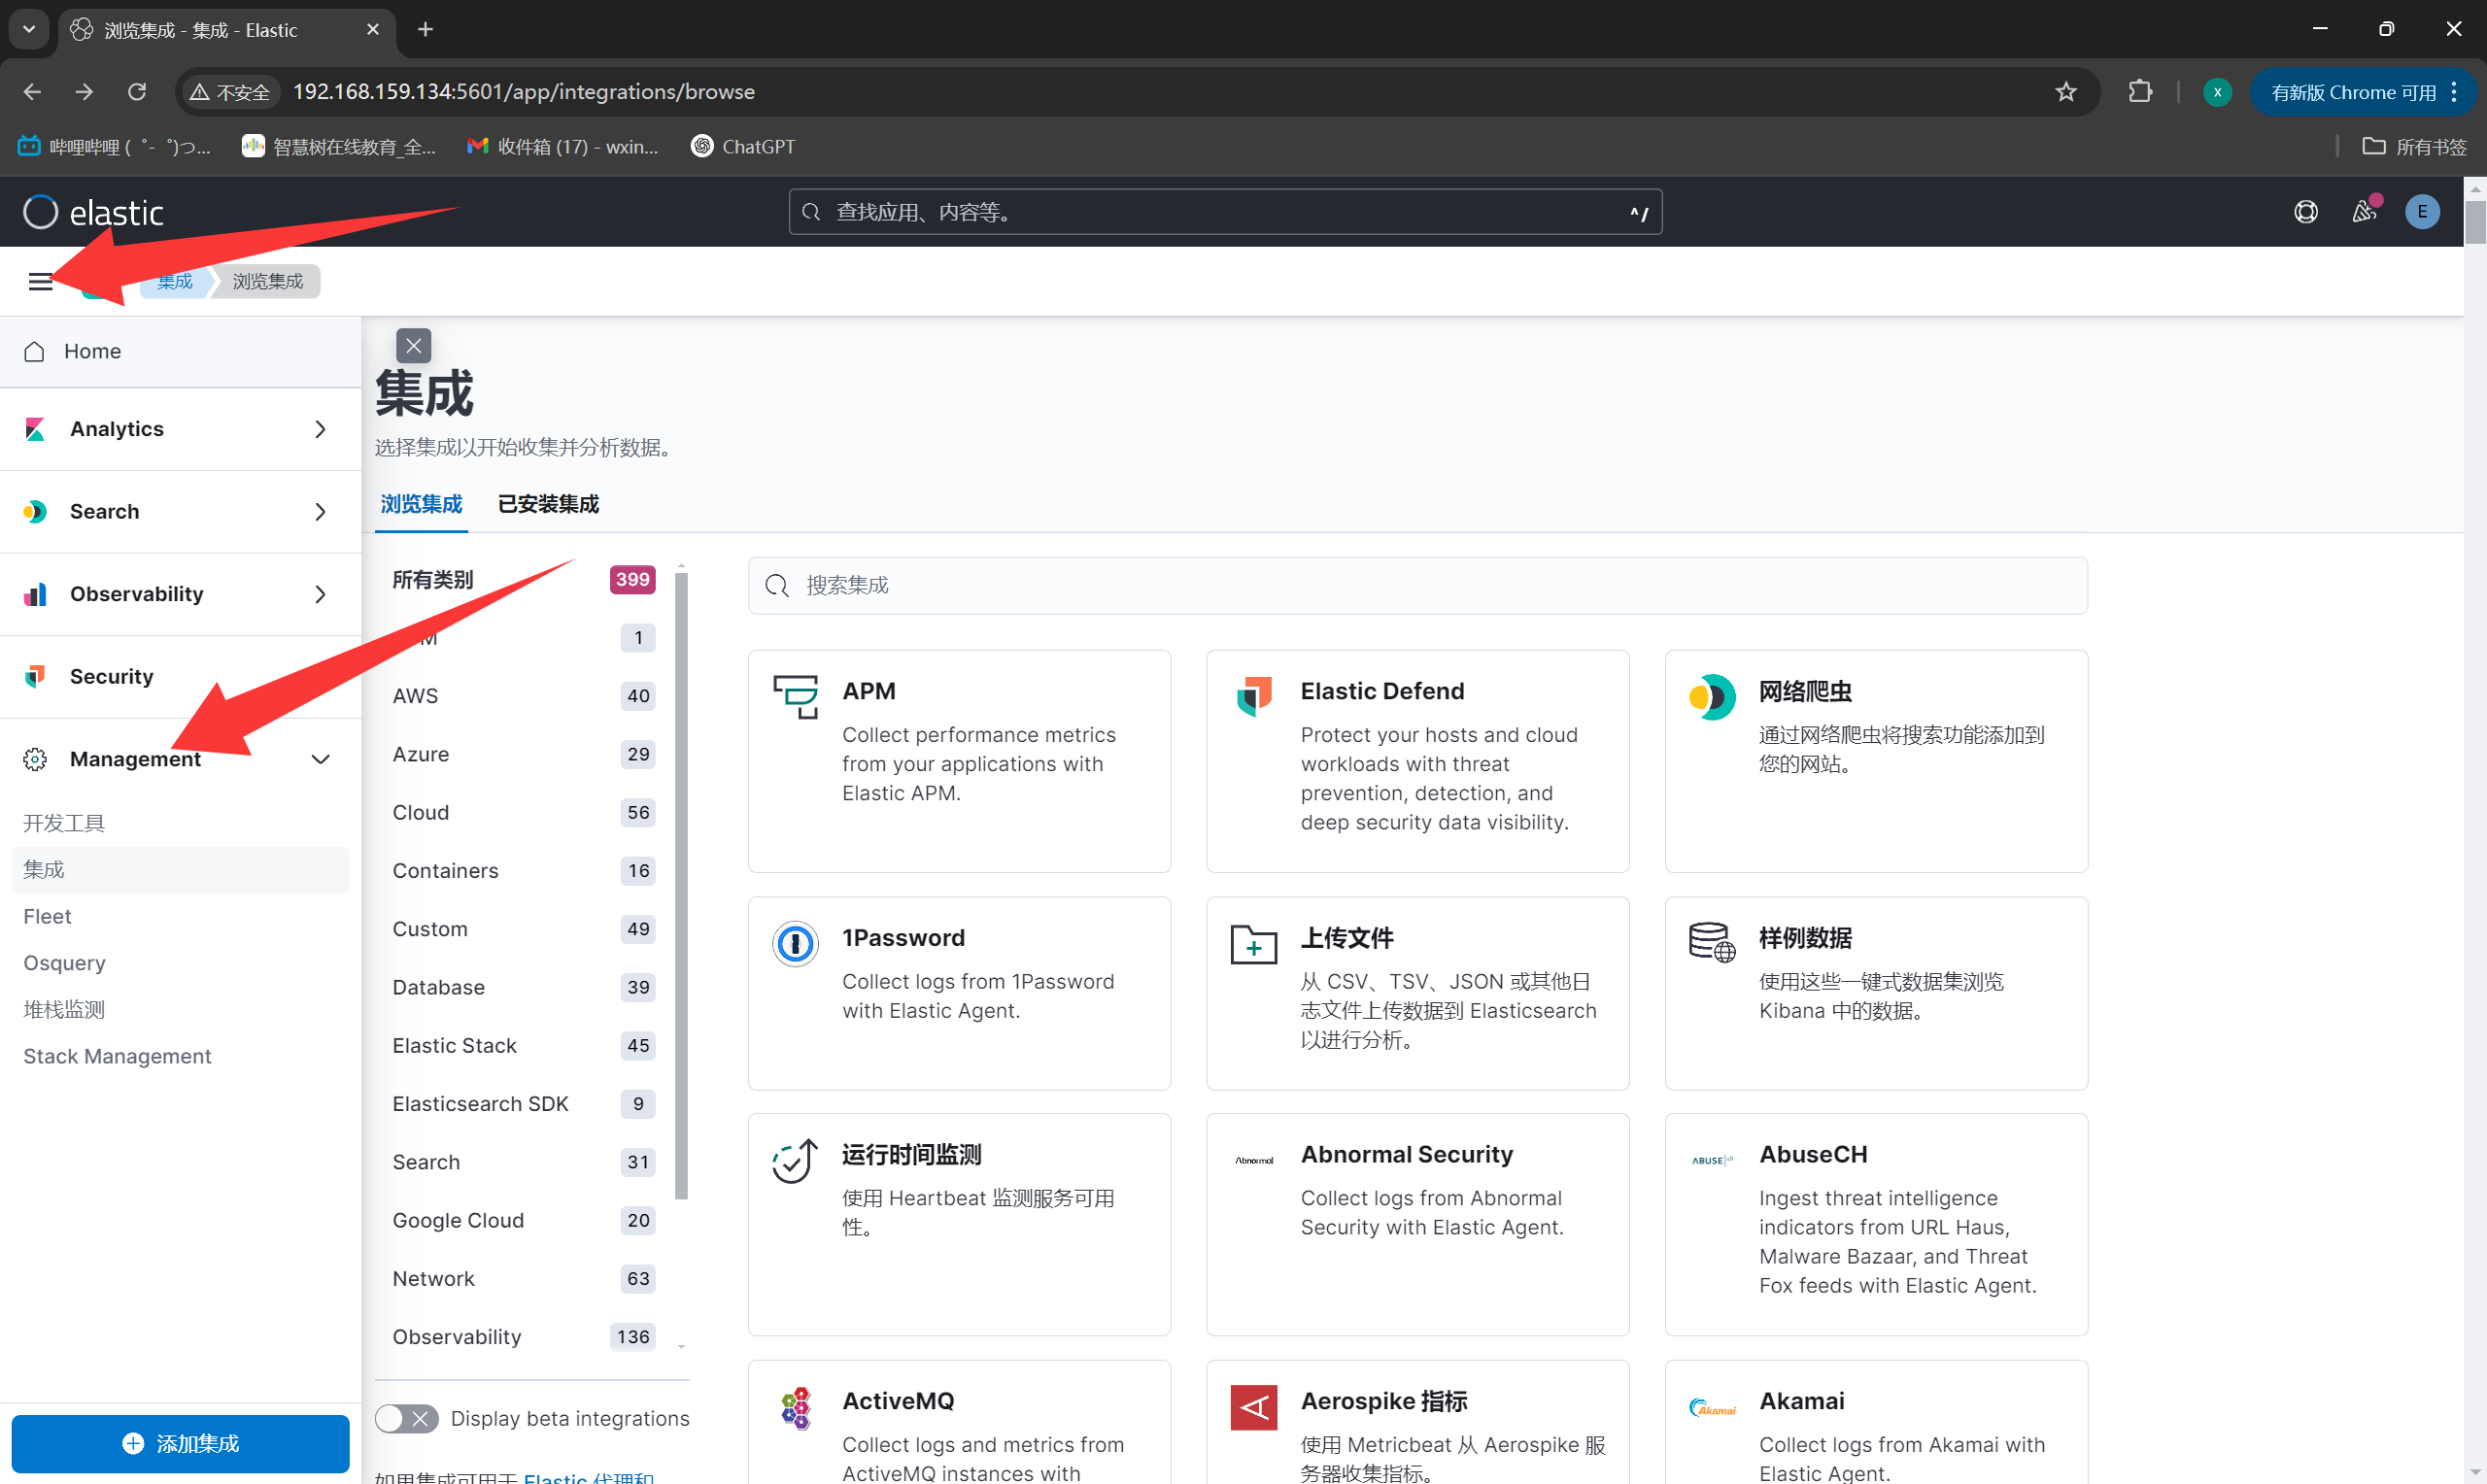
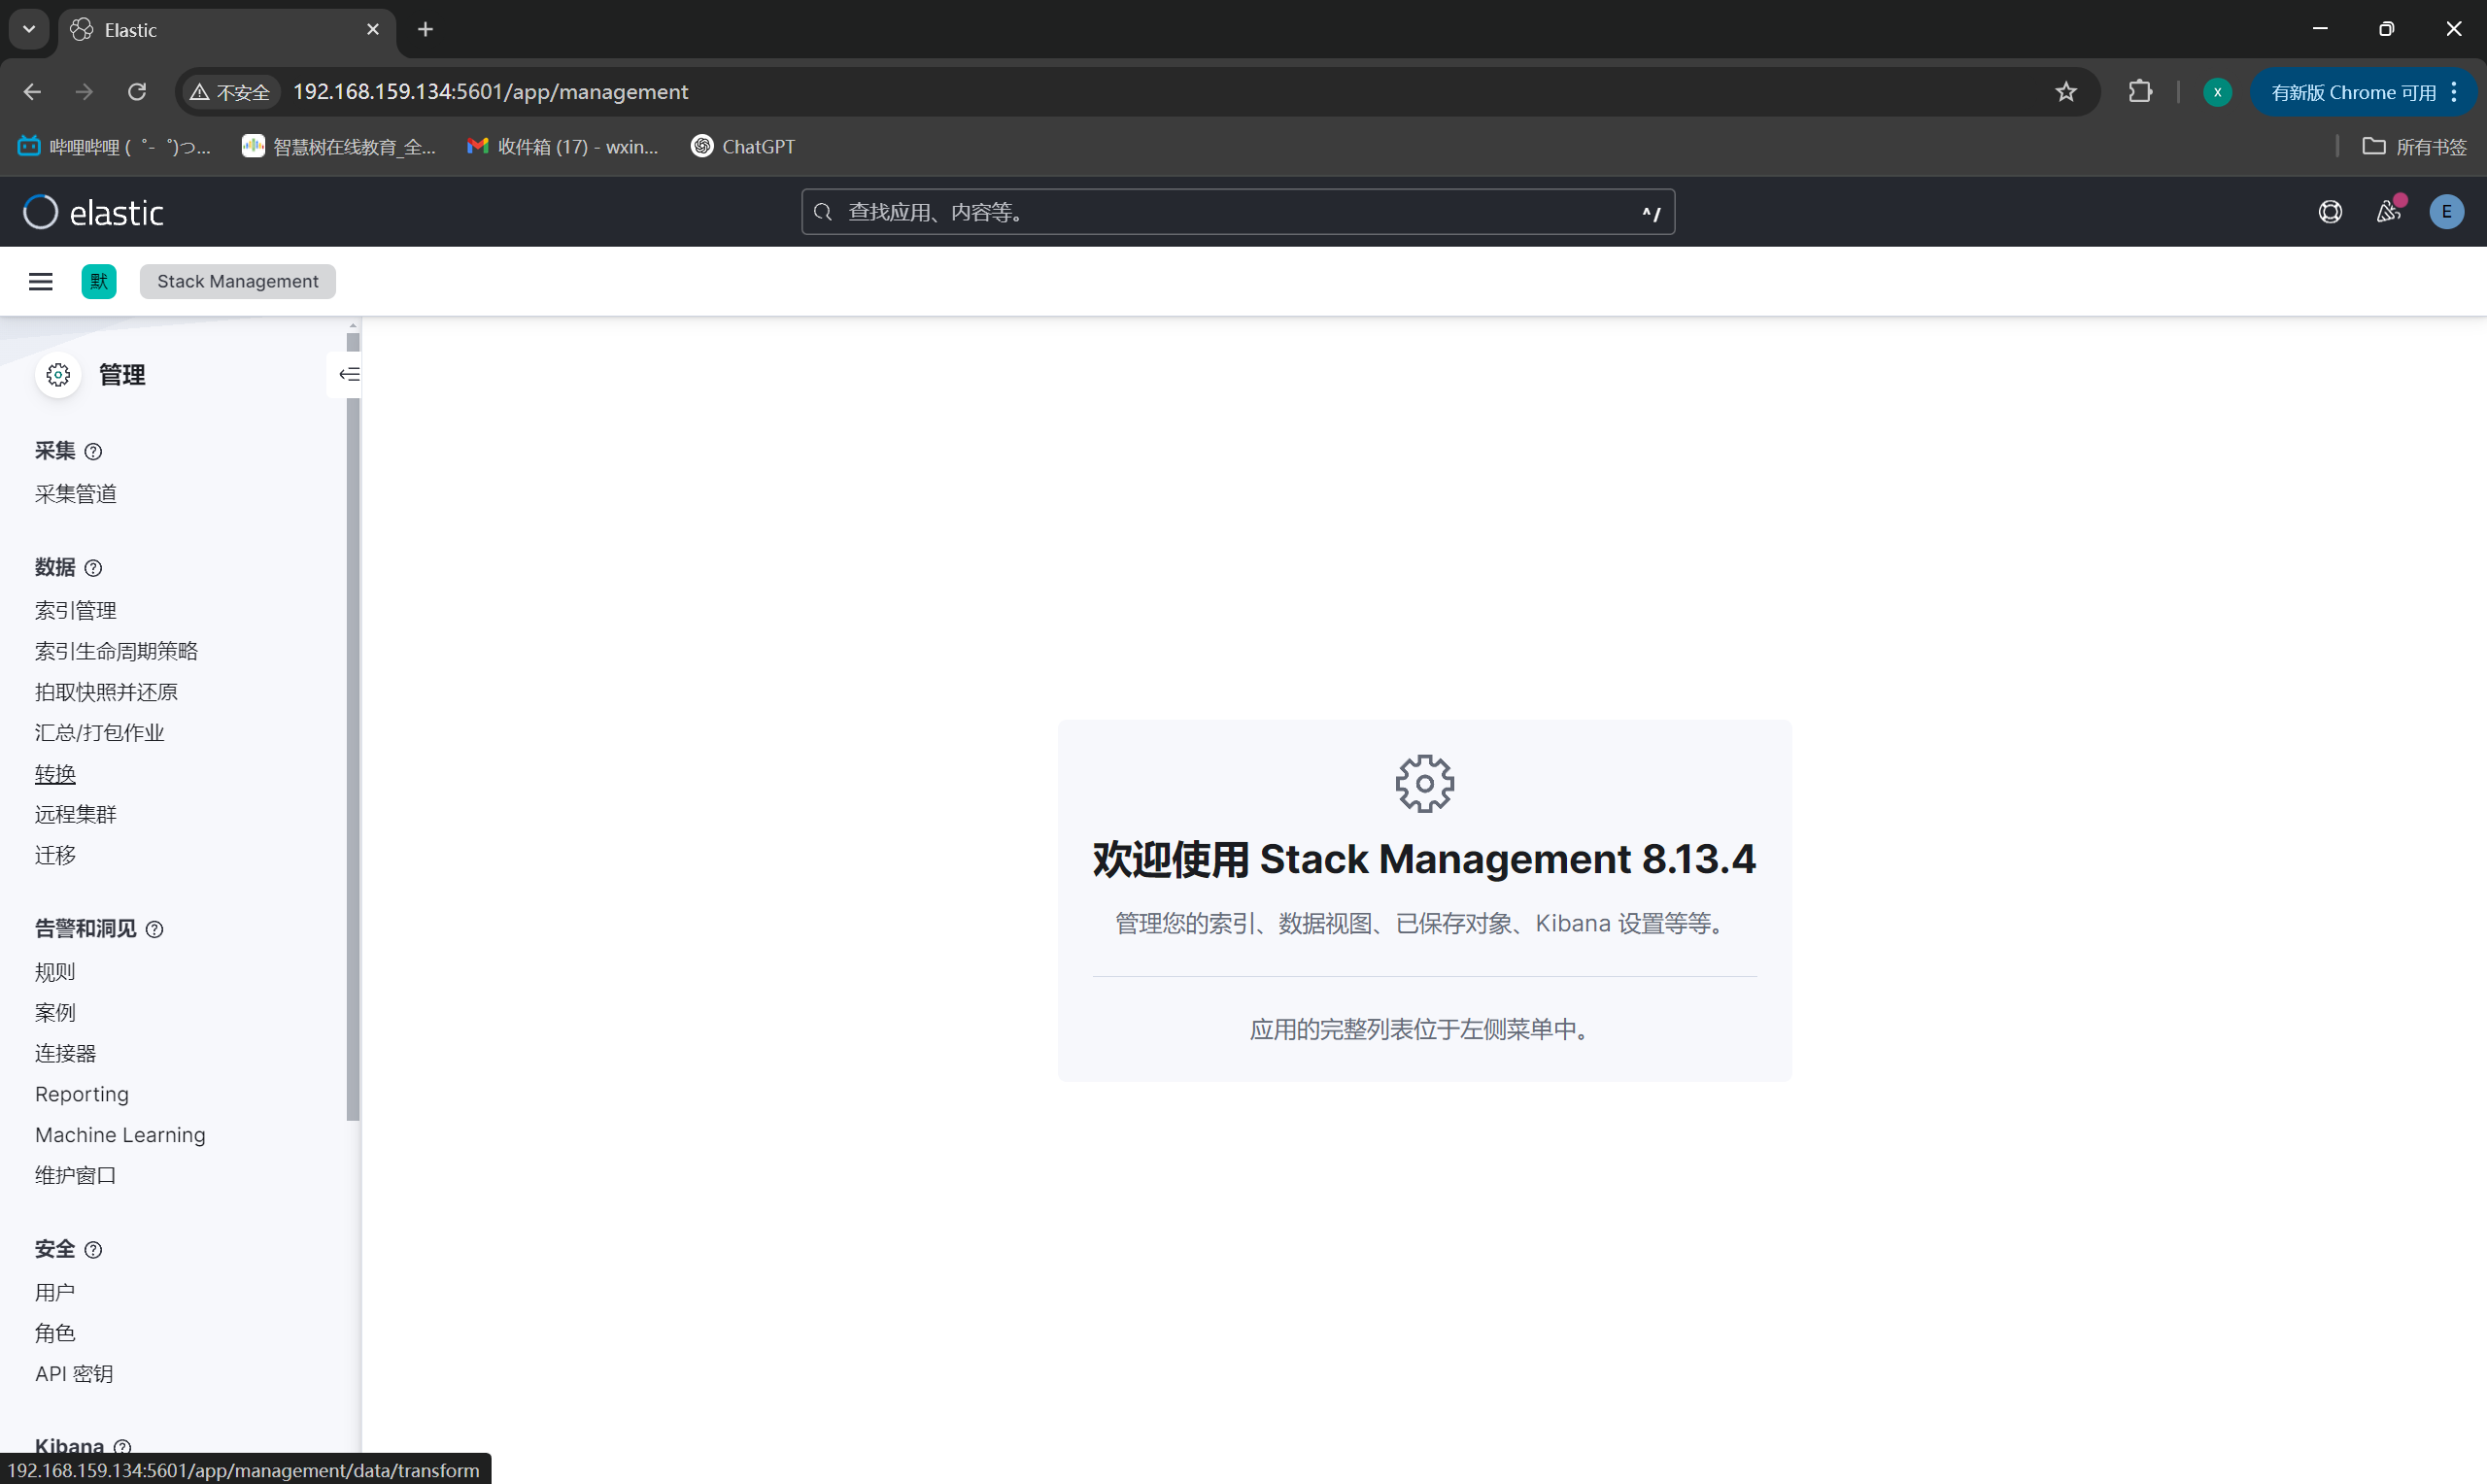
进入管理界面
|
||
|
||
|
||
|
||
|
||
|
||
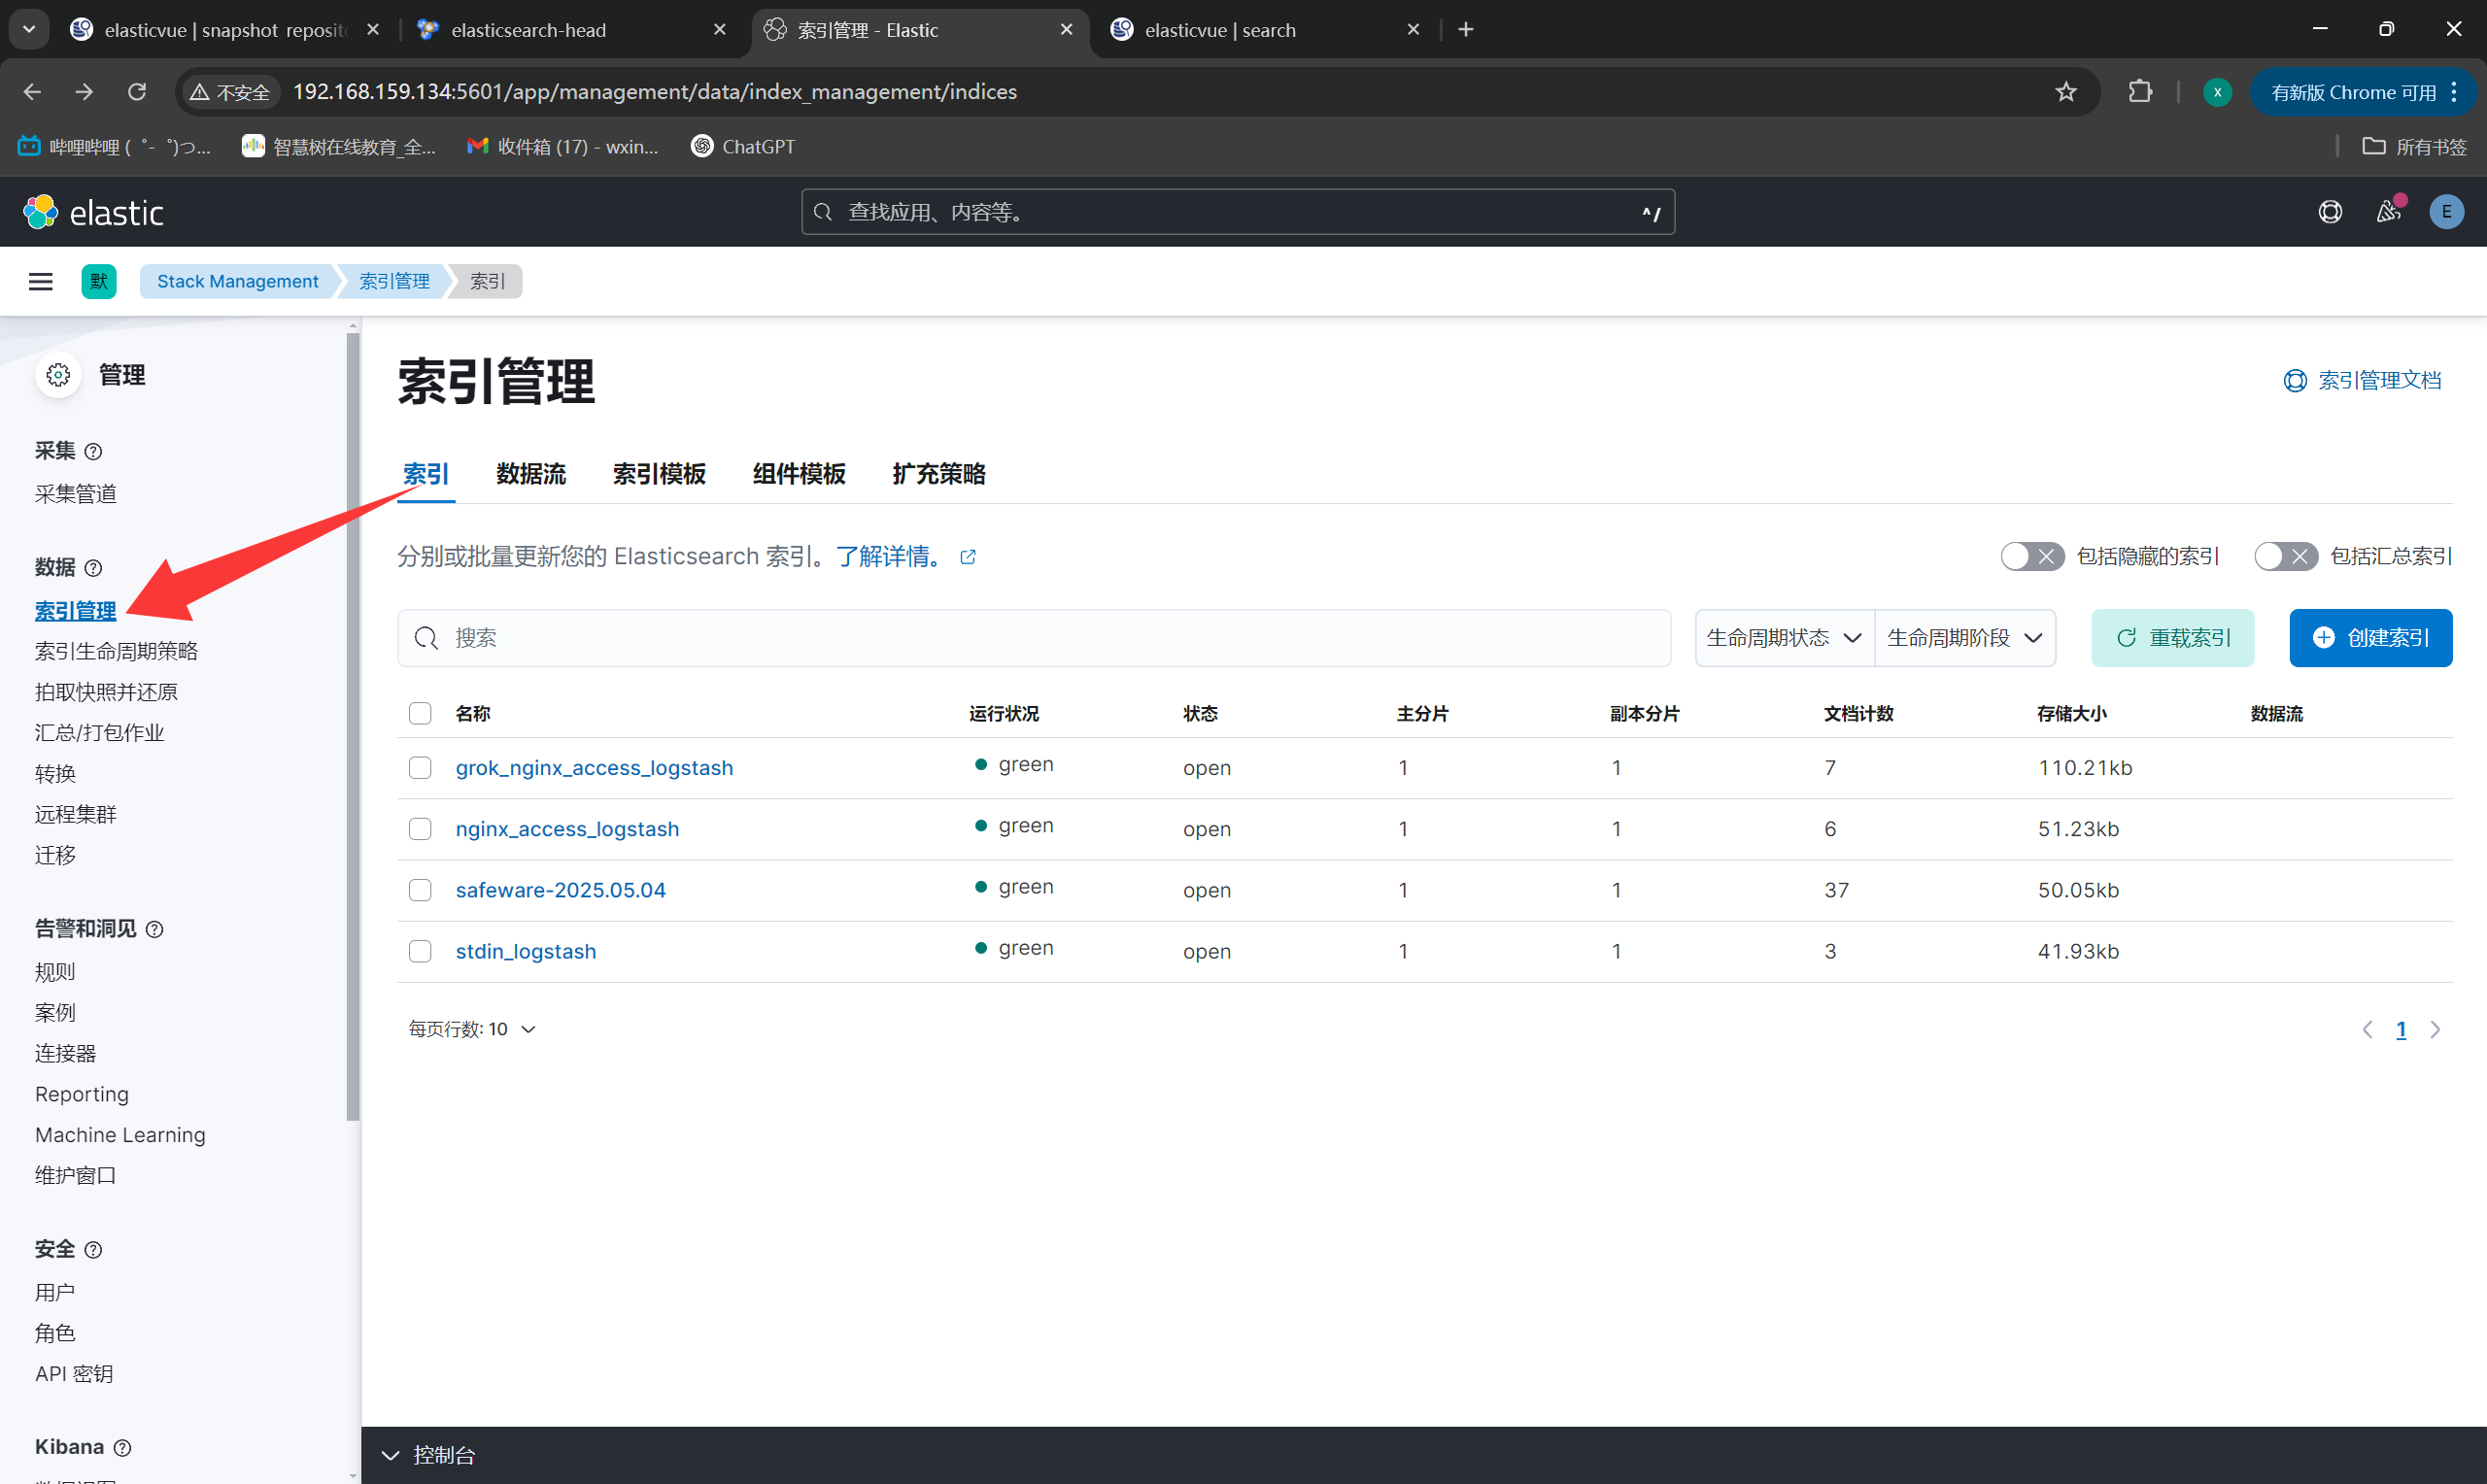
进入索引管理
|
||
|
||
|
||
|
||
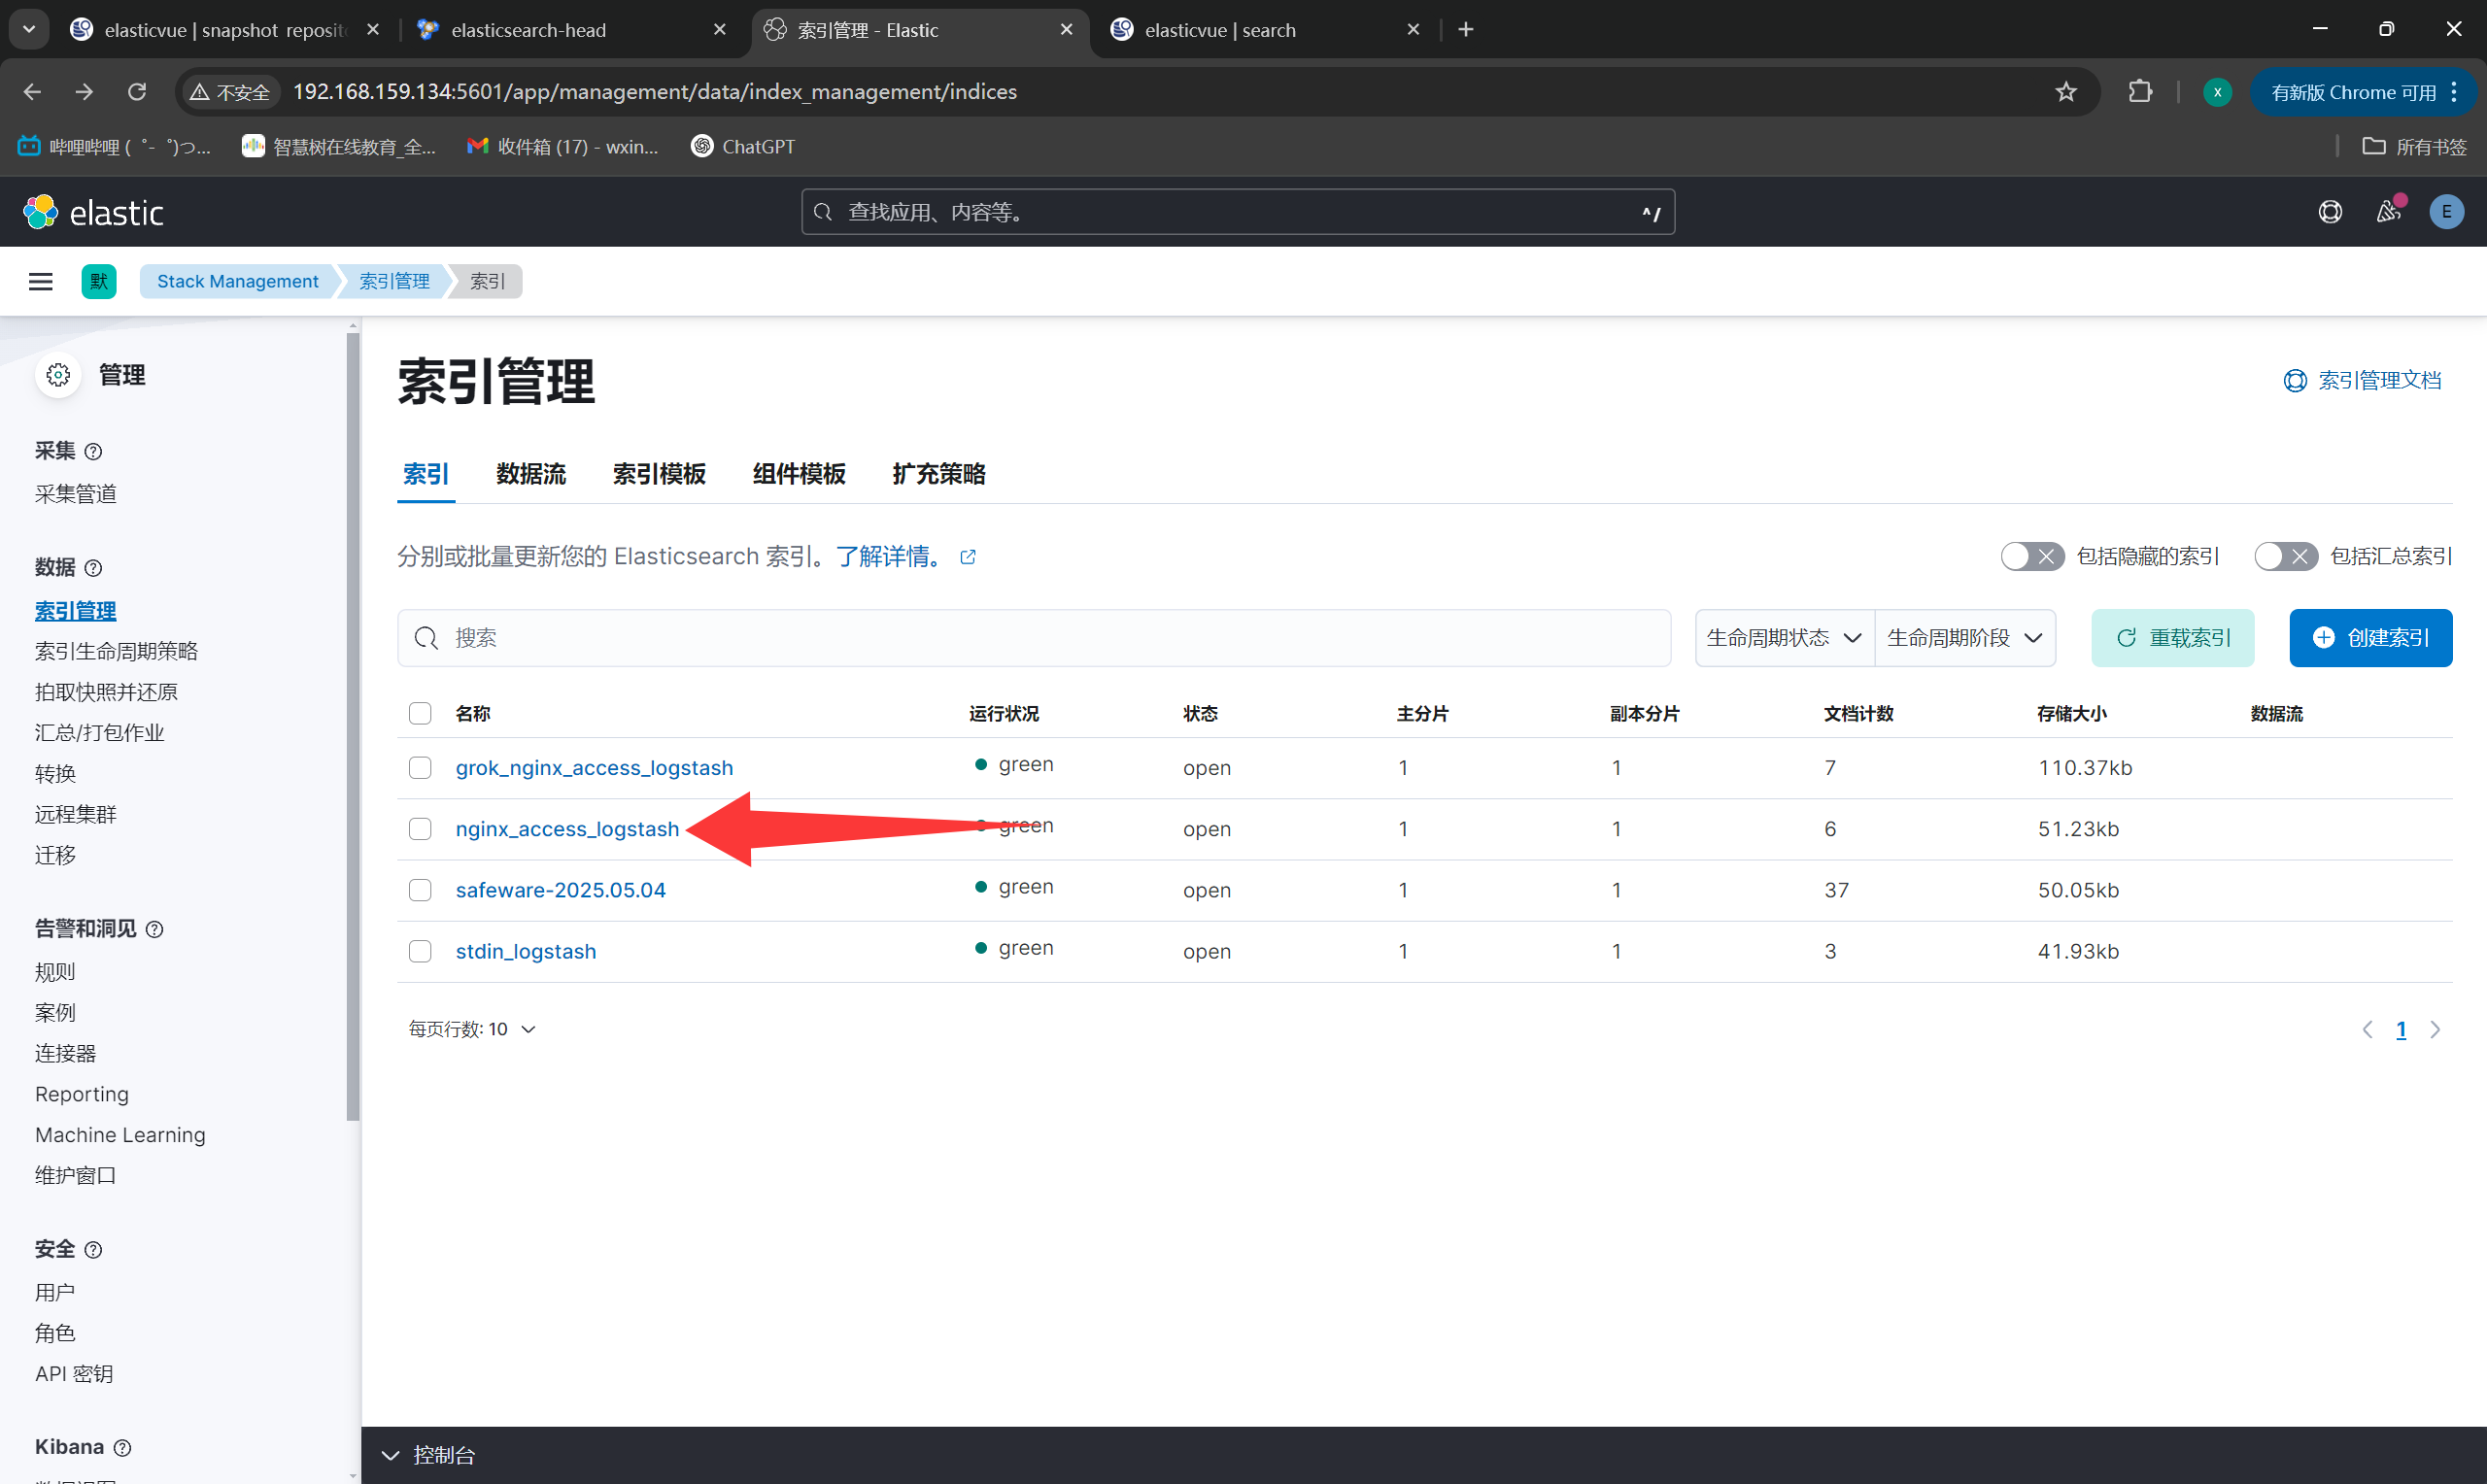
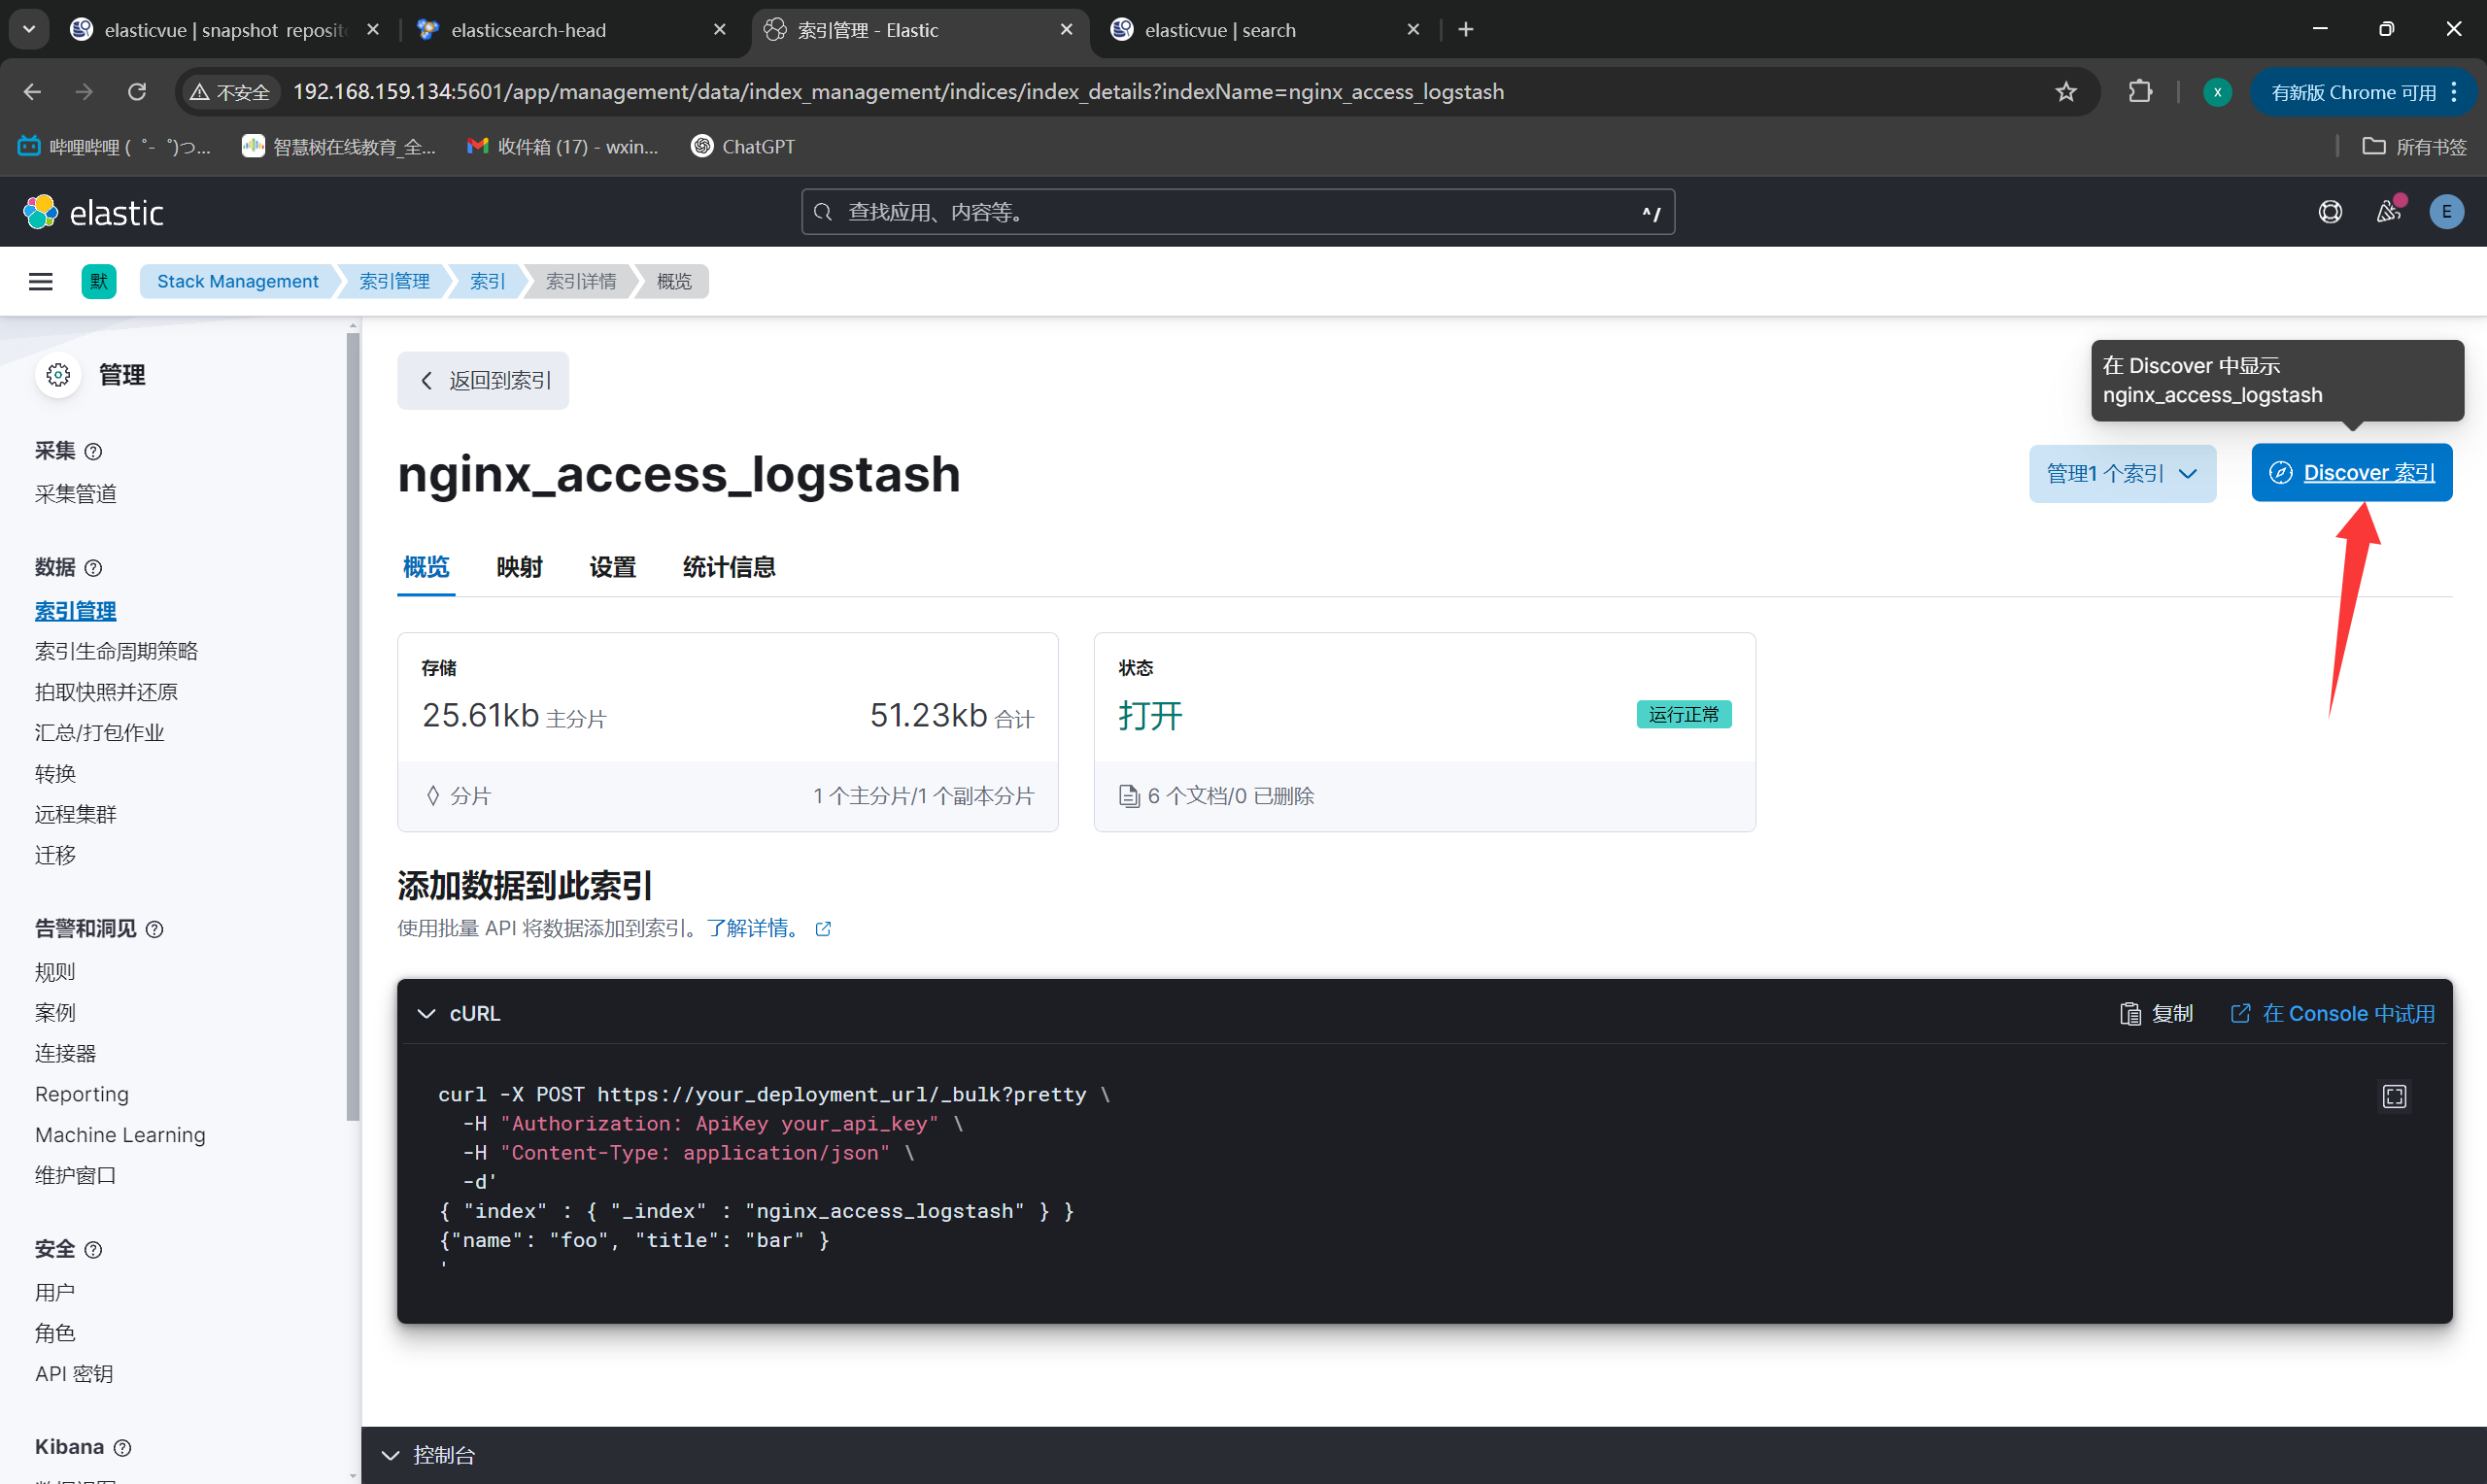
进入要管理的索引
|
||
|
||
|
||
|
||
展示索引数据
|
||
|
||
|
||
|
||
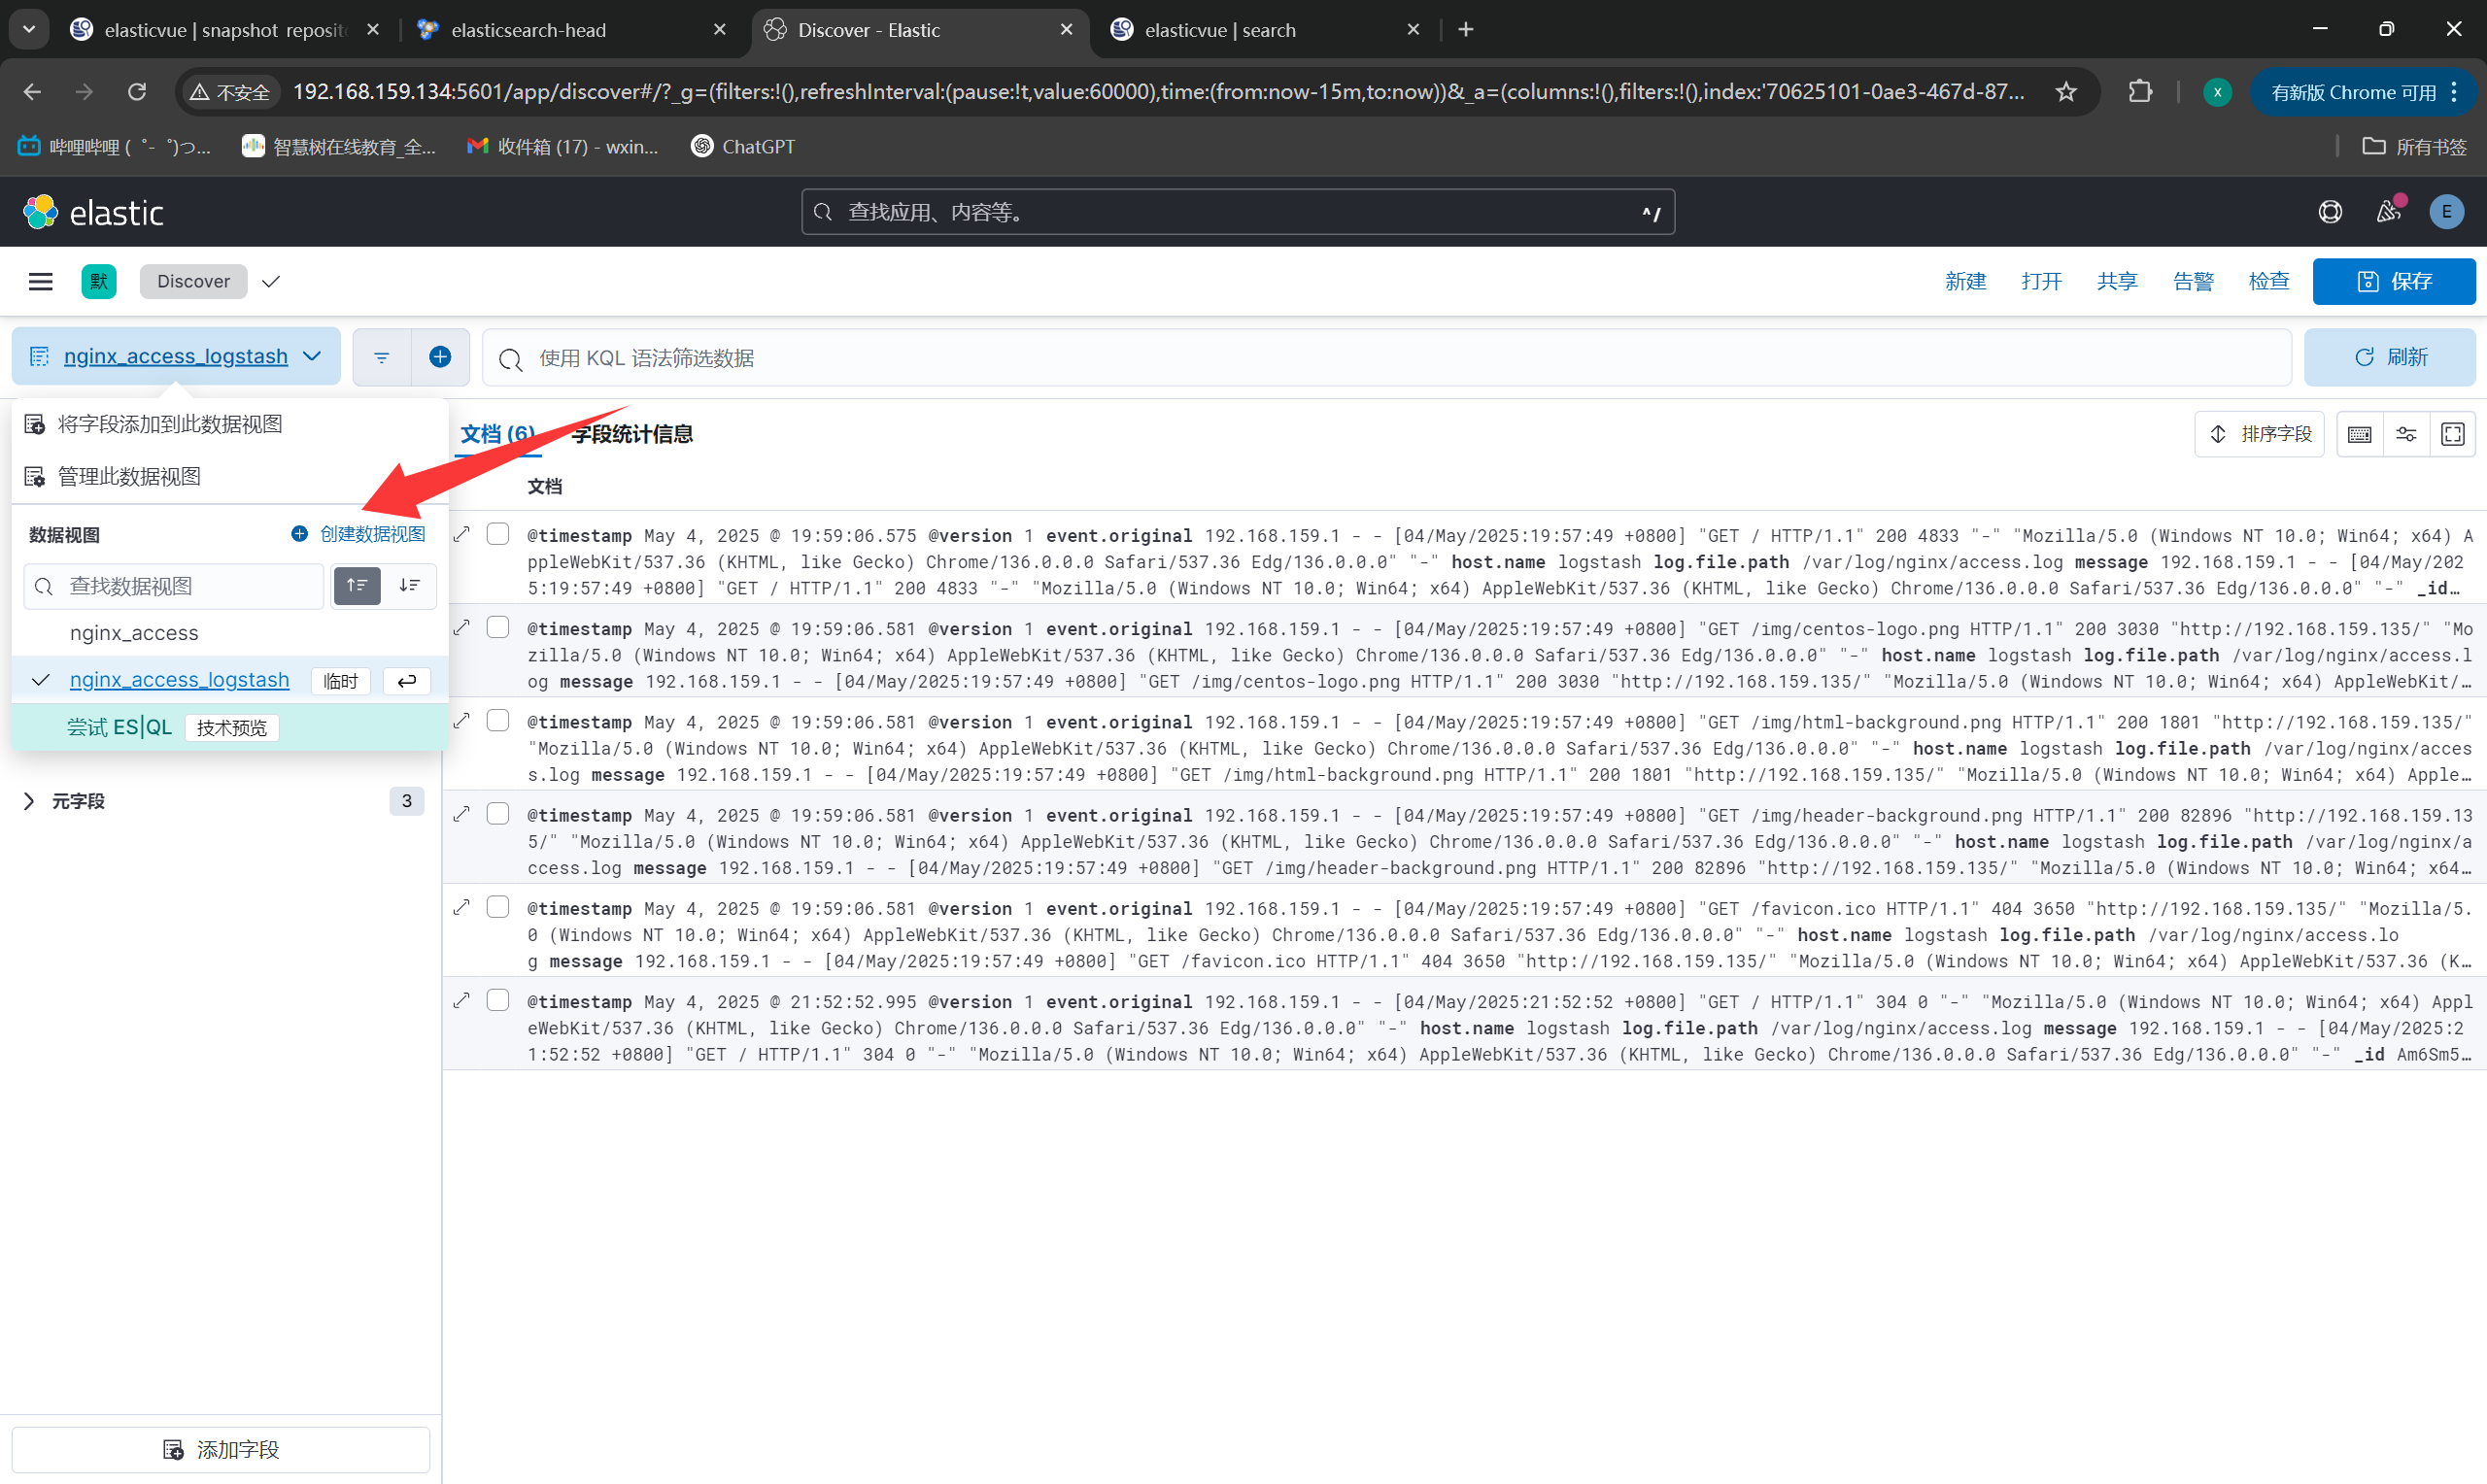
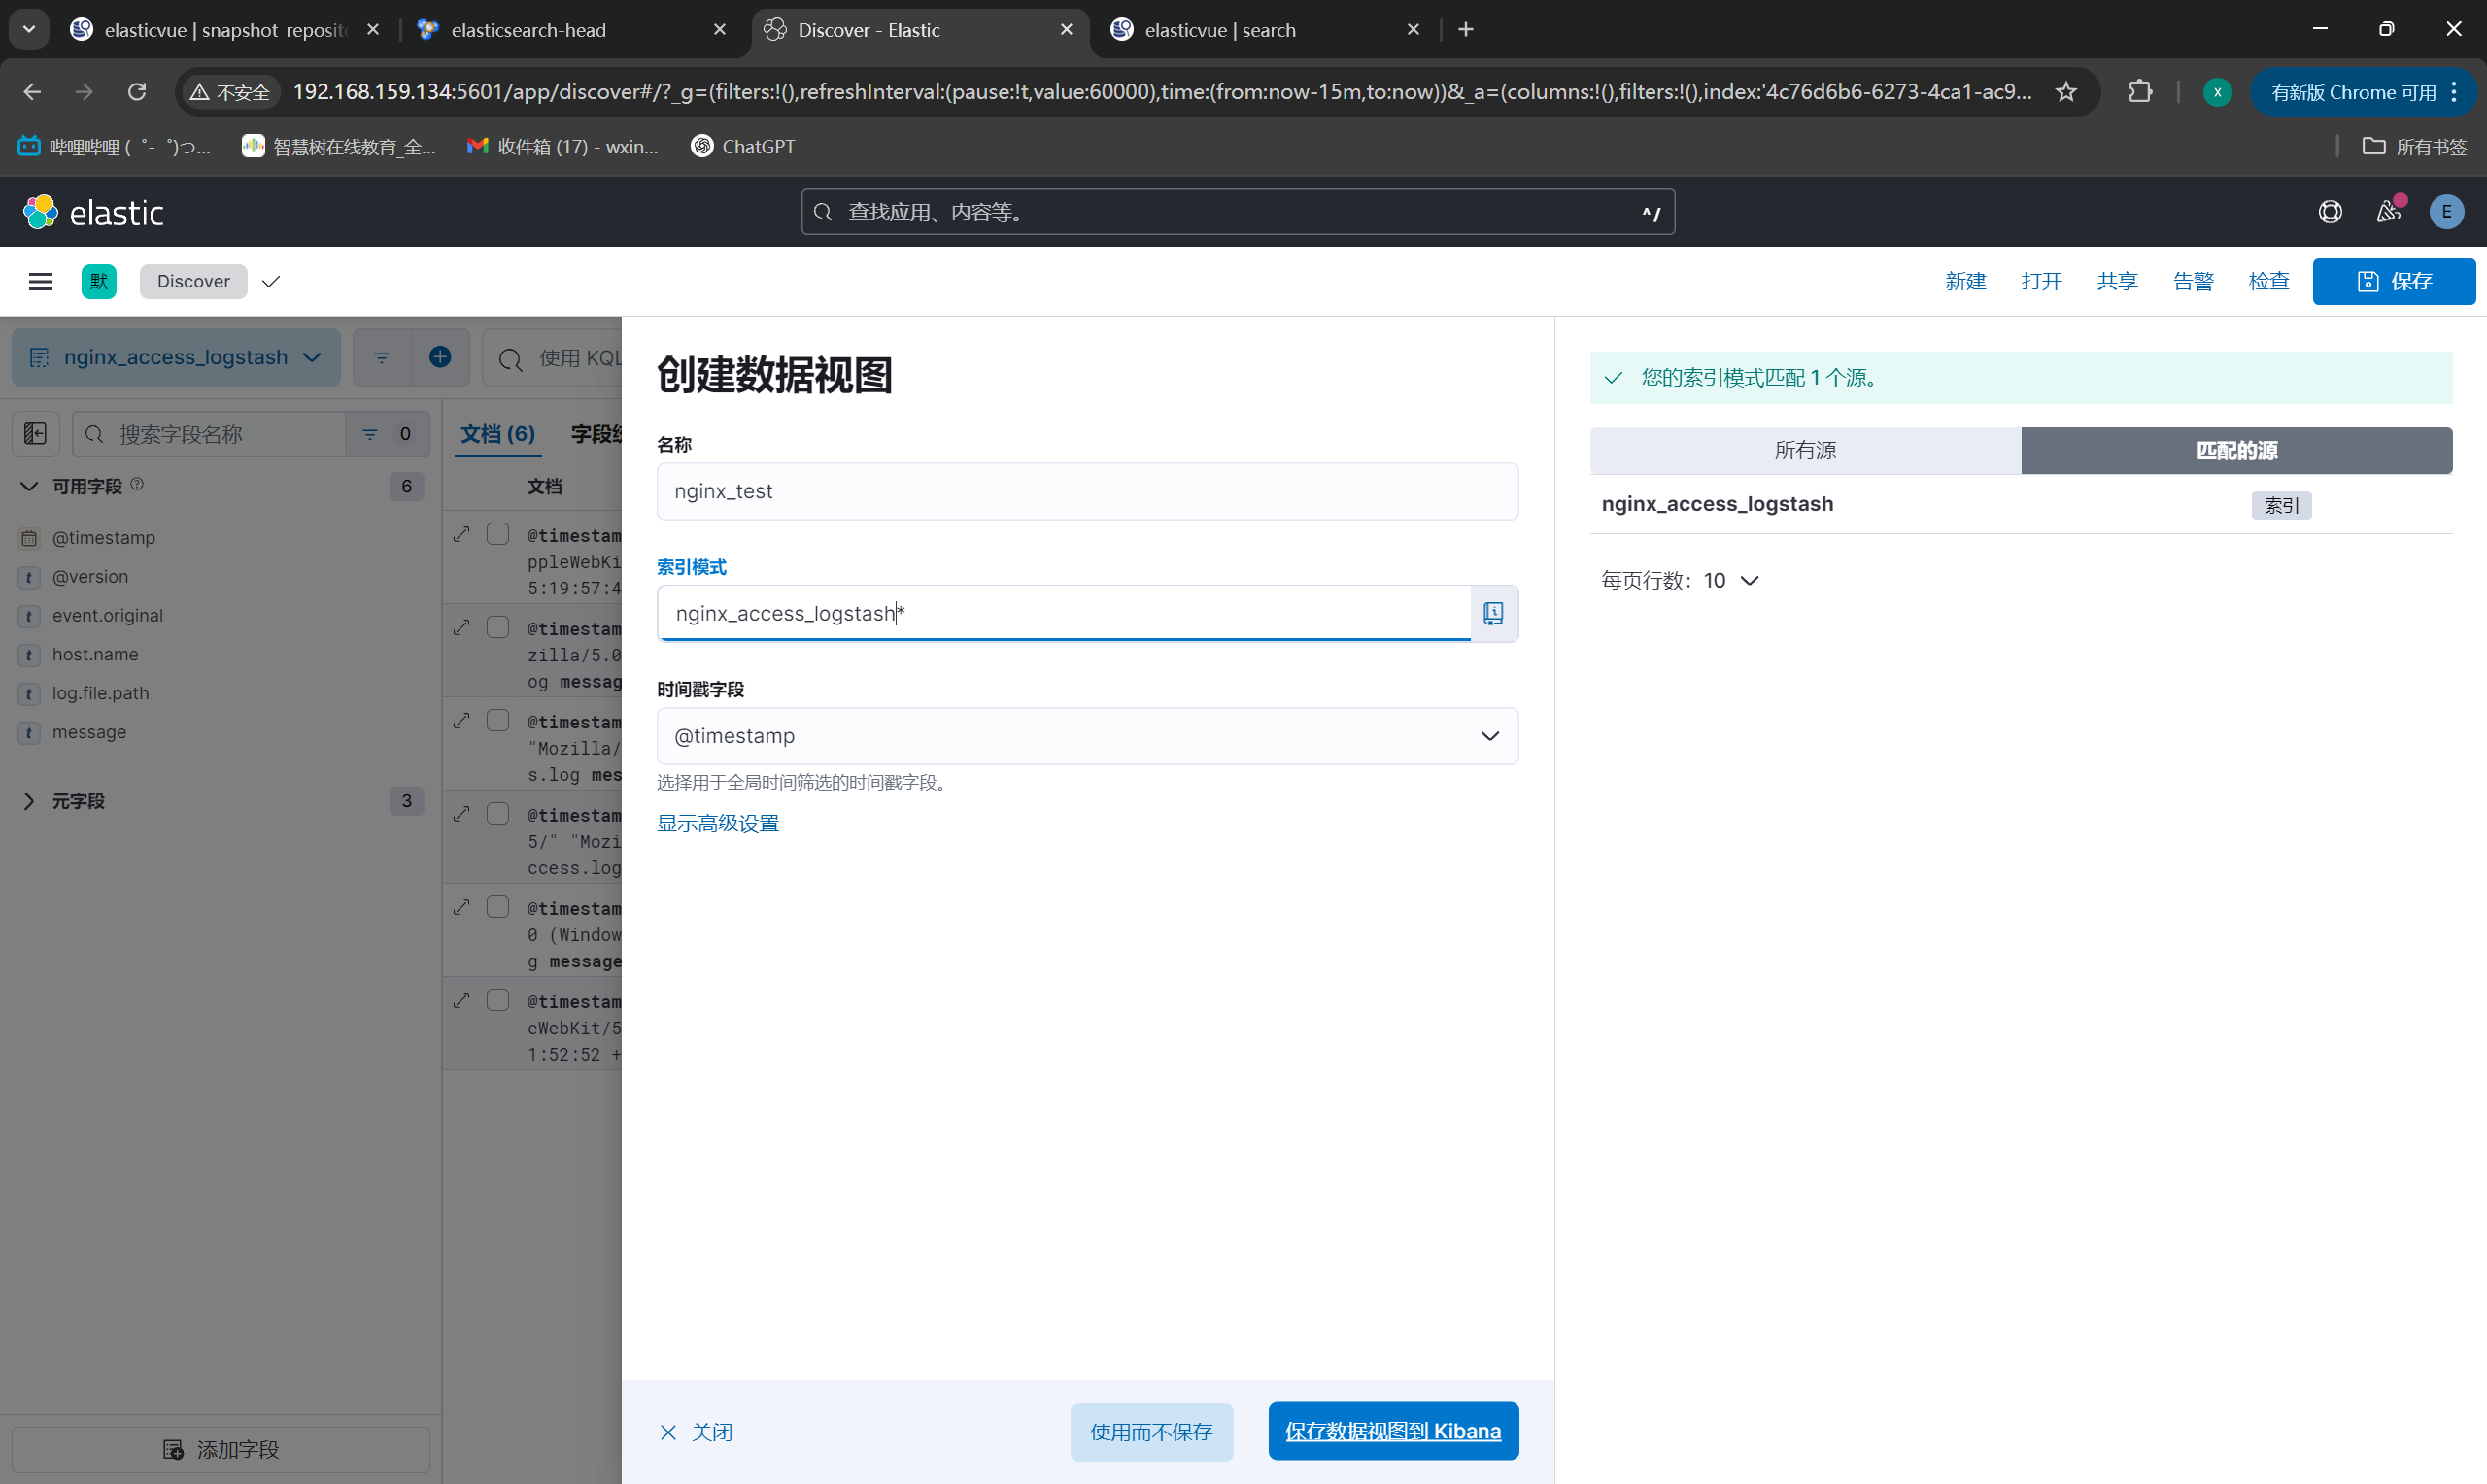
创建数据视图
|
||
|
||
|
||
|
||
|
||
|
||
|
||
|
||
注意:
|
||
|
||
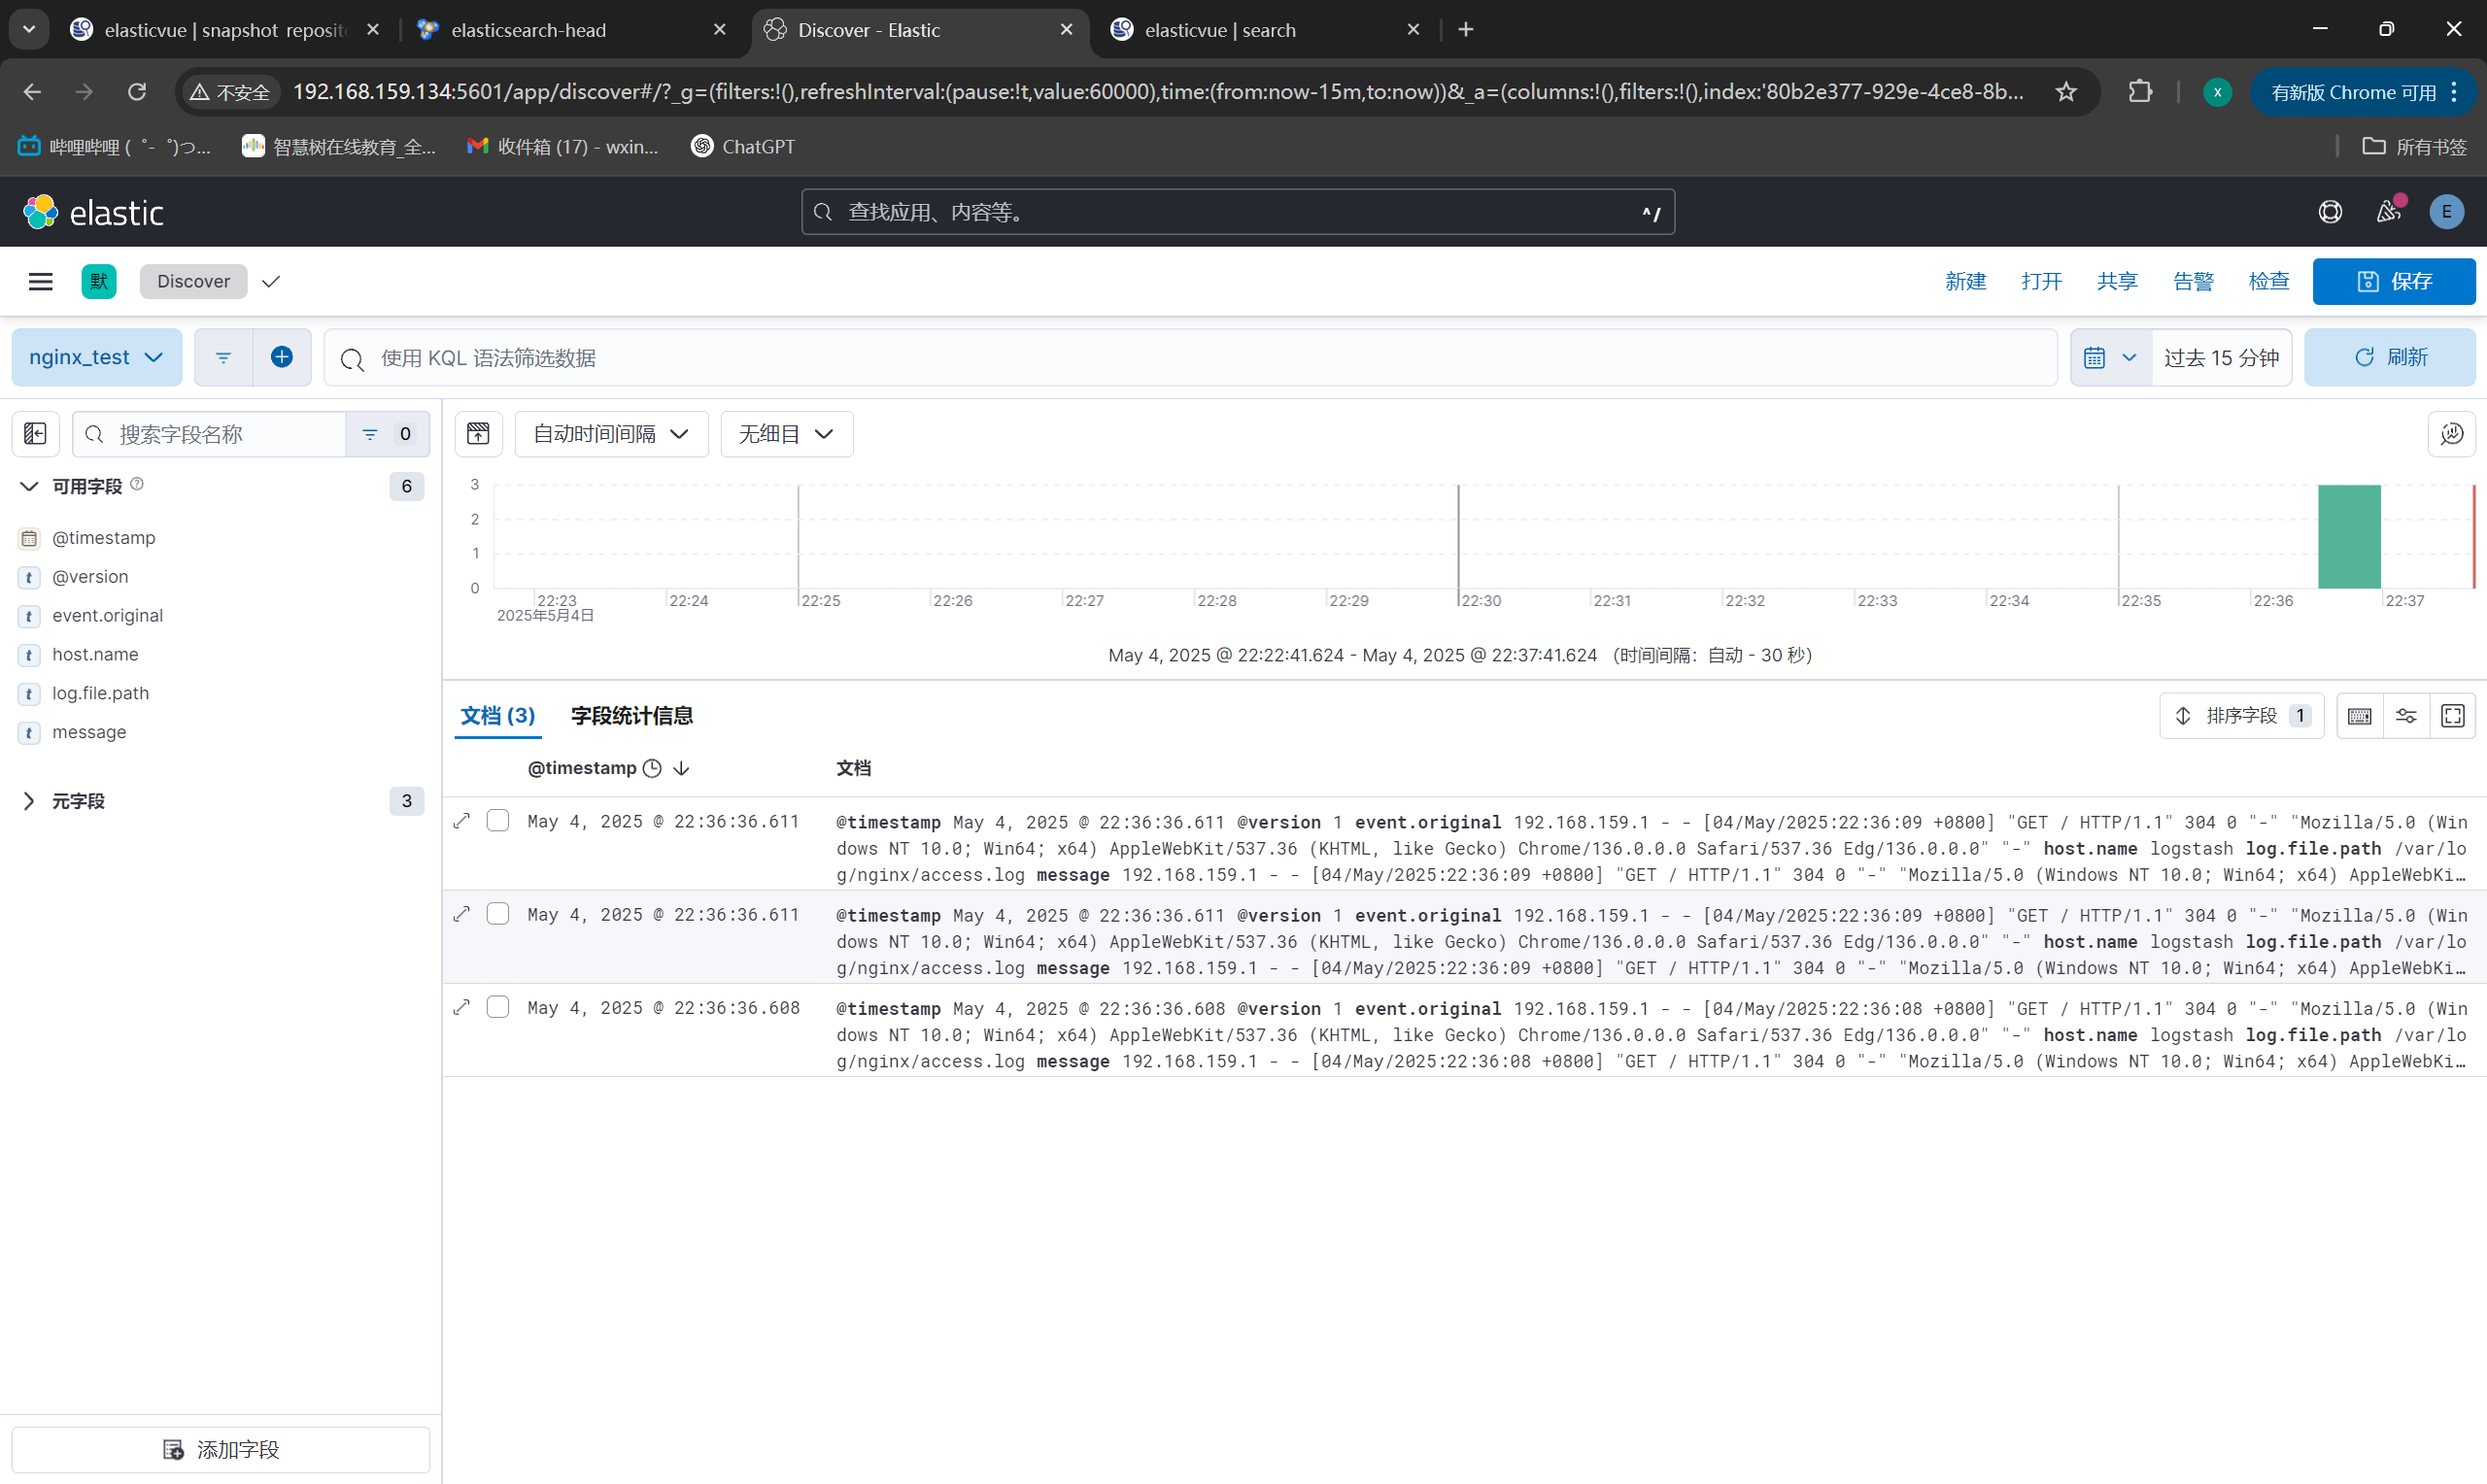
- 这里我们就可以看到Logstash采集的数据,并以图形的方式展示
|
||
- 在图形界面我们可以设置时间范围
|
||
- 在图形界面我们可以设置时间自动刷新时间
|